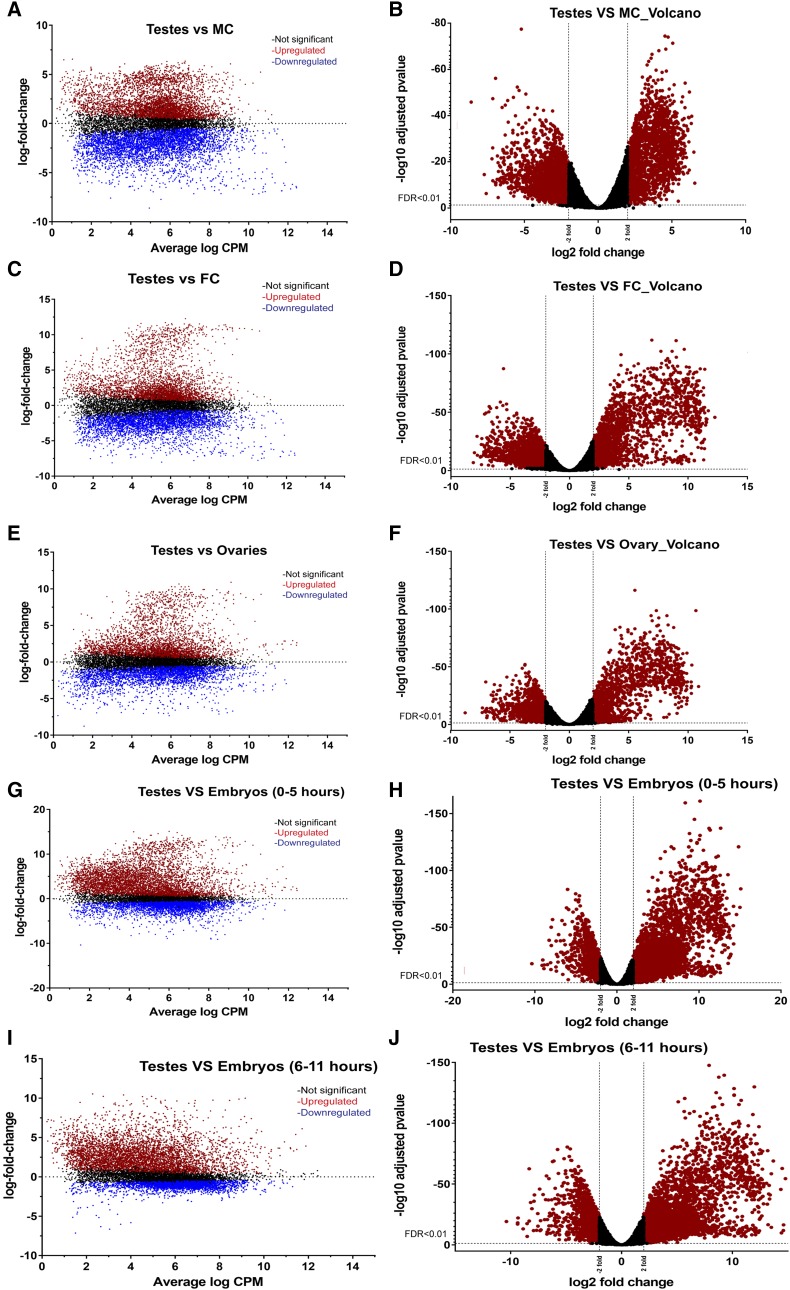
Figure 4.
Gene expression patterns in the Tribolium testis. Differential genes expression in the Tribolium testis compared to male carcass (A –B), female carcass (C-D) ovary (E-F), embryo (0-5 hr) (G-H) and embryo (6-11 hr) (I-J). Colored dots represent individual differentially expressed genes. Red and blue color dots indicate significantly differentially expressed genes; red colored dots on Volcano plots are significant and above twofold or below twofold. N= number of genes DE in greater than or equal to twofold change or lesser than or equal to twofold change.

