

Abstract

Herein, we present an optimized bottom-up approach to fabricate homogeneous Au nanostars with plasmon resonances fully tunable between the red and the infrared. The synthetic method relies on the kinetic control of the reaction upon optimization of the reactant concentrations (i.e., gold seeds, reducing agent, and gold salt). Optical enhancing properties of the obtained materials are demonstrated by using SERS with visible and infrared lasers.
Introduction
Plasmonic particles have many applications in catalysis,1 nonlinear optics,2 enhanced spectroscopy (i.e., SERS, MEF, and SEIRA),3 biology,4 and medicine,5 because of their ability to generate strong electromagnetic fields at their surface upon excitation with the appropriate light. Both the energy and intensity of these fields, also denoted as localized surface plasmon resonances (LSPR), depend strongly on the material, the size, and especially the morphology of the particle.6
Among different morphologies, spiked particles such as nanostars (NSt), consisting of spherical cores with protruding sharp tips, are among the most efficient plasmonic nanoparticles (NPs). In these NPs, the LSPR is highly confined at the tip of the spike, whereas the core acts as an electron reservoir.7 In fact, these NPs are among the very few morphologies that allow for single particle spectroscopy.7b,8 Notwithstanding, the characteristic plasmonic response of spiked NPs begins at the near-infrared (NIR), and although this response can be proficiently exploited for applications such as detection in cells and tissues,9 light-triggered drug delivery,10 or photothermal therapies,11 it inhibits the applicability of these materials under visible light.
It is already established that, during the synthesis of gold nanostars (AuNSt), the spikes are produced because of a preferential growth of the twin boundaries of spherical seeds with a well-defined multitwined crystallographic structure. In fact, these regions are the most reactive areas at the seed surface.12 Consequently, during the growth process, each twin boundary starts growing and develops a spike that generates new twin boundaries. This process results in the growth of more spikes, leading to multispiked structures.12c,13 Besides the use of different seeds, the control over the reduction kinetics and the selective facet reduction are the two key aspects that influence the NSt morphology. Both factors are correlated and influenced mainly by four variables: the temperature, the solvent, the reducing agent, and the reaction time.12c Generally, the temperature plays a crucial role by accelerating or slowing down the reduction kinetics as it is raised or decreased.14 However, for temperatures below 60 °C, there is no appreciable effect on the shape or optical properties of the AuNSt.13b On the other hand, the classical approach for preparing AuNSt is achieved by the reduction of gold ions using poly(vinylpyrrolidone) (PVP)13b in N,N-dimethylformamide (DMF).15 In this synthesis, DMF not only acts as the solvent but also plays an important role in improving the reduction capacity of PVP via an increase of the polymer solubility.7c Notably, the replacement of DMF by another less polar solvent, such as ethanol, slows the reaction rate by reducing the PVP solubility.12c
Herein, we present an optimized bottom-up approach to fabricate highly homogeneous AuNSt, with tunable LSPR response, by controlling the amount of reactants (i.e., gold seeds, reducing agent, and gold salt) and the reaction time. This synthesis enables the precise control over the tip reshaping which, in turn, allows for the fine tuning of the LSPR energy from the infrared to red. Further, to demonstrate the effect of the LSPR tunability on the optical enhancing properties of the stars, SERS intensities of the different materials are also characterized with visible and NIR lasers using a model analyte.
Results and Discussion
Influence of the Seed Concentration on the Plasmon Tunability
The classical method for AuNSt fabrication designed by Liz-Marzan’s group7c relies on the use of gold seeds with well-defined crystallinity (crystal facets formed by {111} planes) that are transferred to ethanol using PVP as the stabilizer.16 Then, the star-shaped NPs are obtained by adding the seeds to a solution containing PVP, DMF, and a gold salt (i.e., HAuCl4). This process is a seed-mediated approach, and therefore, our first attempts to tune the LSPR of AuNSt were focused on varying the amount of seeds added to the growth solution, as typically reported for similar processes.17 As expected, a systematic variation of the amount of seeds allows for the tuning of the LSPR. However, as shown in Figure 1, such tunability is limited to a very restricted spectral range (approximately 700–900 nm). Moreover, a further increase in the amount of seeds to achieve larger blue-shifts leads to the formation of spheroidal particles. Thus, using this approach, the production of NSt with optical properties within the visible range is hampered.
Figure 1.
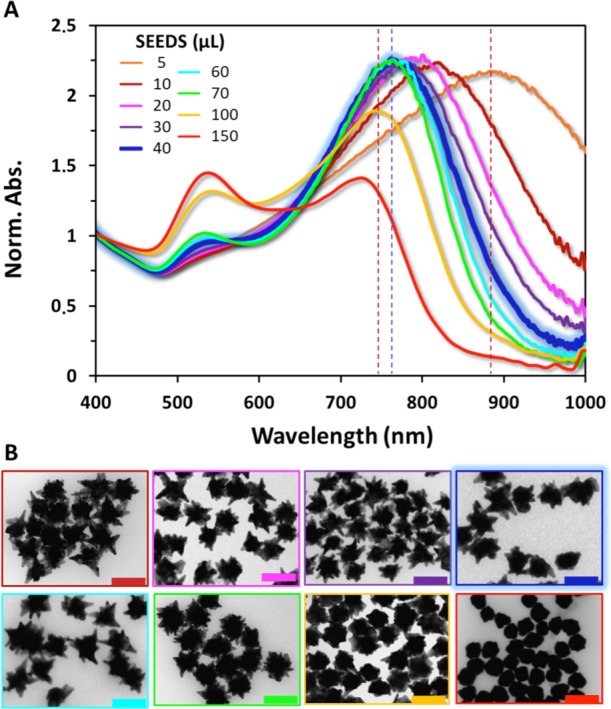
(A) Normalized UV–vis spectra of a set of synthesis, using the traditional DMF/PVP seed-mediated approach, where AuNSt are produced by varying systematically the amount of spherical seeds added to the solution. The spectrum highlighted in blue corresponds to the particles obtained via the standard protocol. (B) TEM images for the particles of the spectra shown in (A). Scale bar = 100 nm.
As an alternative to overcome this limitation, preformed AuNSt can be used as seeds and subsequently overgrown. In this strategy, previously reported for nanorods,15,18 the {111} facets of Au nanorods are selectively grown using PVP. Consequently, the formed rods are thicker, while still maintaining sharp tips, and the LSPR shifts to the blue. Therefore, the first step to produce tunable AuNSt was the synthesis of highly homogenous AuNSt seeds by the classical PVP/DMF seed-mediated approach as previously described.7c This protocol usually yields AuNSt with a maximum plasmon contribution around 750 nm. Nonetheless, in our experiments, we choose to produce AuNSt with LSPR around 850 nm to demonstrate the excellent tunability, from the NIR to the visible range, provided by the method.
Influence of the PVP Concentration on the Plasmon Tunability
Besides stabilizing the NPs, PVP also acts as a reducing agent. Therefore, different concentrations of PVP, using ethanol as the solvent to slow the reaction rate,12c were investigated to optimize the best conditions while all other parameters (volume, [AuNStseed], and [HAuCl4]) were maintained constant. The [HAuCl4]/[AuNStseed] ratio (R1) is critical to effectively modify the morphology and, thus, the optical properties of particles.18 Thus, as previously discussed for the preparation of thick nanorods, a low concentration ratio of gold salt to seeds was selected as the starting point (R1 = 1.7). Then, the concentration of PVP was varied in relation to a fixed concentration of gold salt (8.57 × 10⁻⁵ M), according to the [HAuCl4]/[PVP] ratio (R2) in the 0.1 to 1.5 range.
Figure 2A shows some examples of the variation of the LSPR profile with time for reactions with different R2. The degree of the blue-shift as a function of time, for each reaction (R2 from 0.1 to 1.5), is presented in Figure 2B. Although plasmonic shift cannot be considered a direct measurement of the growth kinetics of NPs, it is directly related to the shape transformation. A simple examination of the temporal response of the LSPR reveals a Langmuir shape (exponential rise to the maximum value), which indicates first-order kinetics. Following the Prout–Tompkins model19
| 1 |
which when integrated and rearranged
| 2 |
where θ is the conversion fraction, t is the time of reaction, and k is the conversion-fraction-dependent rate constant. Assuming the conversion factor is Δλ/Δλ0, eq 2 can be rewritten as
| 3 |
and directly used to fit the kinetic data. The blue-shift, expressed as Δλmax, and the variation of k with R2 are presented in Figure 2C,D, respectively. These results reveal that, although for a fixed concentration of gold salt all reactions display LSPR blue-shifts with time, its overall variation increases with R2. This indicates that larger PVP concentrations promote shape stabilization as previously reported.20 On the other hand, [PVP] also affects the transformation kinetics. As it can be observed, the transformation kinetics is faster as R2 decreases (Figure 2D). However, it is interesting to point out that, for all R2 values, the transformation kinetics is slow, ranging from 100 h for R2 = 1.5 to 150 h for R2 = 0.1. Thus, with the aim of increasing both the reaction rate and the LSPR tunability, the effect of [HAuCl4] at fixed [PVP] was also investigated. To this end, a R2 of 0.2 ([PVP] = 4 × 10⁻⁴ M) was defined. This value is around 20 times smaller than the conventional amount7c and was selected because, although it does not promote the larger blue-shift or reaction rate, it still provides full colloidal stability to the AuNSt in solution.
Figure 2.

(A) Normalized UV–vis spectra for the overgrowth process at low, optimal, and high R2. (B) Reaction kinetics at different R2 at a fixed HAuCl4 concentration (8.57 × 10⁻⁵ M) and [HAuCl4]/[AuNStseed] ratio (R1 = 1.7). Variation of the (C) maximum blue-shift and (D) kinetic constant with R2.
Influence of the HAuCl4 Concentration on the Plasmon Tunability
The [HAuCl4]/[AuNStseed] ratio (R1) usually influences the final particle size and therefore strongly affects the optical response of the final structures. For example, for elongated particles, a sequential increase in R1 yields thicker nanorods that may finally be transformed into octahedrons.15,18Figure 3A shows examples of several reactions where R1 was varied at fixed AuNStseed and PVP concentrations. The extent of the blue-shift as a function of time for each reaction (i.e., for R1 from 0.1 to 1.5) is illustrated in Figure 3B. Analogous to the kinetic curves obtained by varying R2, those presented here show a Langmuir-shaped profile and, thus, were fitted with eq 3. Notably, the total blue-shift dramatically increases with R1, that is, with [HAuCl4], reaching LSPR below 600 nm for the largest gold salt concentration (Figure 3C). Surprisingly, the reaction rate severely decreases with R1. The blue line (Figure 3D) shows an exponential decay of the reaction rate as more gold salt is added to the reaction until stabilization is reached for R1 values above 0.3 (purple line). Notably, for low values of R1 (0.1 and 0.2), the gold salt is fully consumed before higher blue-shifts can be achieved. For values between 0.3 and 1.5, the kinetic constant remains very similar. This fact is in contrast to the increase of this parameter as a function of R2 (Figure 2D). When [PVP] is raised, at fixed gold salt and AuNStseed concentrations, the reaction rate decreases because the polymer tends to wrap the NPs, making the interaction of the gold ions with the metallic surface more difficult. On the other hand, the formation of complex species between Au(III) and PVP is well-known,21 promoting the stabilization of the ions in solution. Differently, when [HAuCl4] is increased, at low PVP and seeds concentrations, the kinetic constant remains steady due to the low amount of polymer on the particle surfaces, which slows the epitaxial reduction process of the particle (PVP also acts as the reducing agent).
Figure 3.

(A) Normalized UV–vis spectra for the overgrowth process at low, optimal, and high R1. (B) Transformation kinetics at different R1 at fixed concentrations of AuNStseed and PVP. Variation of the (C) maximum blue-shift and the (D) kinetic constant, obtained by fitting eq 3 to the data, with R2.
On the other hand, the UV–vis spectra reveal a gradual increment of the LSPR intensity when R1 is increased from 0.1 to 0.6 (Figure 3A and Figure S1). Above this value of R1, the LSPR intensity drops. Thus, for the efficient modulation of LSPR, [HAuCl4] should be relatively low to avoid fast reduction kinetics but high enough to enable LSPR tuning.
Effect of the Reaction Time on the Plasmon Tunability
The above results make it clear that the LSPR can be appropriately tuned by the thermodynamic control of the reaction. However, this control requires careful readjustment of the reactant concentrations, which may considerably decrease the reaction rate. Alternatively, the kinetic control of the reaction can provide AuNSt at the desired LSPR (below 600 nm) with increased intensity and narrower plasmonic bands. This is clearly displayed in Figure 4. Here, NSt were overgrown under optimized conditions (R1 = 0.6 and R2 = 0.2, where [AuNSt] = 1.24 × 10⁻⁴ M, [PVP] = 4 × 10⁻⁴ M, and [HAuCl4] = 8 × 10⁻⁵ M). Aliquots of the colloids were sampled over time and mixed with a large amount of PVP to quench the reaction. UV–vis spectra and TEM and optical images of each aliquot were then acquired. The results show that the LSPR position can be kinetically controlled (Figure 4A) and finely tuned in the very broad 570–870 nm spectral range. Notably, LSPRs display narrower features with intensities higher than the initial AuNSt seeds (in some cases, more than 50% larger). On the other hand, TEM images exhibit AuNSt with well-defined tips (Figure 4B and Figures S2 and S3).
Figure 4.

(A) UV–vis spectra of different AuNSt after overgrowing AuNSt seeds with an initial LSPR maximum at 870 nm. (B) Six selected TEM images corresponding to the highlighted spectra shown in (A). Spectra and TEM images were obtained after stopping the reaction and subsequent particle cleaning. Scale bar = 50 nm. (C) Optical images of the obtained solutions of AuNSt.
Origin of the Plasmon Tunability
To gain further understanding on the origin of such outstanding plasmon tunability, a detailed morphological characterization of the colloidal materials was performed. To this end, the structure of more than 100 AuNSt from each of the samples shown in Figure 4 and Figures S2 and S3 was examined in terms of (i) tip length, (ii) tip thickness, (iii) tip angle, and (iv) core diameter. Their corresponding histograms are shown in Figures S4–S7. These morphologic parameters together with their LSPR maximum for all samples are presented in Figure 5. Notably, the factor that influences the most the plasmon position is the tip angle, as previously predicted in the literature,7a,7b with the tip length, core diameter, and tip thickness as minor contributors.
Figure 5.

Morphologic parameters (tip length, tip thickness, tip angle, and core diameter) of the prepared AuNSt as a function of their maximum LSPR response.
Optical Enhancing Properties of the Tunable NSt
To test the effect of the plasmon tuning on the optical enhancement properties of the prepared NSt, benzenethiol (BT) was used as an optical probe. Diluted samples of AuNSt (10–4 M in gold) containing a BT concentration of 10–6 M were explored with a macrosampling accessory using two laser lines, 633 and 785 nm. All the samples yielded the characteristic SERS spectra of BT for both lasers (Figure 6A). However, the intensity provided by each sample excited with the different laser lines was very different (Figure 6B). For the NIR laser (785 nm), maximum intensities were provided by NSt with a plasmon centered at 795 nm. Then, intensity abruptly decayed, both for red- and blue-shifts. Conversely, for the red line (633 nm), maximum intensity was provided by the NSt with the plasmon located at 657 nm. Following a similar trend to that observed for the infrared laser, the enhancement of the AuNSt decreased significantly for NSt, with plasmons shifted both to higher and lower wavelengths. Both excitation lines provide maximum SERS intensities when the LSPRs are centered slightly to the red of the excitation line, with a subsequent decrease in the intensity as the electromagnetic coupling between the LSPR and the excitation line also decreases.22 Thus, the trend of plasmon correlation with excitation frequency is strictly followed in full agreement with previously reported results for plasmon-sampled SERS.23
Figure 6.

(A) SERS spectra of BT acquired with two different laser lines, 633 and 785 nm, on AuNSt with plasmons centered at 657 and 795 nm, respectively. (B) Variation for both excitation lines of the SERS intensity of the symmetric CC ring stretching mode (1575 cm–1) of BT as a function of the maximum LSPR for each AuNSt sample.
Conclusions
In summary, we show the possibility of tuning the optical response of spiked NPs from the NIR to the visible range, while retaining a high plasmon efficiency. Plasmon tunability arises from the kinetic control during a seed-mediated process, where the seeds are standard NSt. Through the careful control of the reactant concentrations and the appropriate quenching of the reaction at the desired time, it is possible to finely control the plasmon position of the AuNSt. Optical characterization through plasmon-sampled SERS indicates full correlation between the SERS intensity, the laser line, and the plasmon position. Finally, the fine control of the LSPR position of these interesting particles may broaden the applicability of NSt in many fields, such as plasmonic catalysis, nonlinear optics, enhanced spectroscopy, biology, and medicine.
Methods
Materials
PVP (MW = 25000) was purchased from Roth. Gold(III) chloride trihydrate (99.9%, HAuCl4·3H2O), trisodium citrate dihydrate (≥99.5%, C6H5Na3O7·2H2O), and absolute ethanol (≥99.9%, EtOH), were obtained from Sigma-Aldrich. DMF (≥99%) was acquired from Fluka. All reactants were used without further purification. Milli-Q water (18 MΩ cm–1) was used in all aqueous solutions, and all the glassware was cleaned with aqua regia before the experiments. SERS experiments were carried out on a Renishaw Raman inVia System using a macrolens collector and two laser lines (633 and 785 nm).
Synthesis of Spherical Gold Seeds
Spherical multitwined gold NPs of approximately 12 nm in diameter were produced by a modification of the well-known Turkevich method.24 Briefly, the Au particles were prepared by boiling 500 mL of Milli-Q water using a condenser to prevent solvent evaporation. Next, 11 mL of sodium citrate (0.1 M) was added (final citrate concentration was 2.2 mM) under vigorous stirring. After 10 min, a HAuCl4 aqueous solution (833.0 μL, 0.1 M) was added, and the mixture was allowed to react for 30 min under continuous boiling and stirring. During this time, the color of the solution gradually changed from colorless to purple to finally become deep red. The final Au concentration was 1.6 × 10⁻⁴ M.
Transfer and Concentration of the Spherical Gold Seeds
After cooling, the produced Au seed particles were transferred to ethanol using PVP as a phase transfer agent.16b Concretely, the gold NPs (500 mL) were added drop by drop under vigorous stirring to a previously sonicated (30 min) aqueous PVP solution (500 mL, 0.27 mM). To guarantee that PVP adsorption on the gold NP surface was complete, the reaction mixture was stirred for 24 h at room temperature. To transfer the PVP-stabilized particles into ethanol, the volume of the solution was firstly reduced using a Rotavapor for 1 h at 60 °C and 90 mbar, until a total volume of approximately 250 mL was left. Finally, the Au seeds were centrifuged twice (9000 rpm, 45 min), the supernatant was discarded, and the particles were dispersed in 40 mL of EtOH to achieve a final Au concentration of 16.2 × 10⁻⁴ M.
Synthesis of AuNSt and Tuning the λmax by Varying the Amount of Spherical Au Seeds
AuNSt were prepared following a modification of the standard PVP/DMF approach.2,7c,25 Eight different flasks were prepared by dissolving 1g of PVP in 5 mL of DMF; after its complete dissolution, the mixtures were further sonicated for 30 min to assure homogeneity of the polymer in the solution. Next, an aqueous solution of HAuCl4 (17.25 μL, 0.0997 M) was added to each bottle under vigorous stirring at room temperature. Immediately after, different volumes of the PVP-coated Au seeds in ethanol ([Au0] = 16.2 × 10⁻⁴ M) were rapidly added (5, 10, 20 30, 40, 60, 70, 100, and 150 μL) to the solutions. Within 15 min, the color of the solutions changed from pink to blue, indicating the formation of AuNSt. The solutions were left under stirring overnight to assure the reduction of all reactants. The AuNSt were cleaned via centrifugation (7500 rpm, 40 min) and resuspended in 5 mL of EtOH. Note that the amount of seeds used for the standard NSt synthesis corresponds to 40 μL.
Synthesis of AuNSt Seeds
AuNSt were produced in the same way as previously stated, but in this case, a total volume of 60 mL was prepared. To do this, 12 g of PVP was dissolved in 60 mL of DMF; after its complete dissolution, the mixture was further sonicated for 30 min. Next, an aqueous solution of HAuCl4 (207 μL, 0.0997 M) was added under vigorous stirring at room temperature. Immediately after, 400 μL of the Au seeds in ethanol ([Au0] = 16.2 × 10⁻⁴ M) was rapidly added, and the solution was left under stirring overnight. The AuNSt were cleaned by two centrifugation steps, first at 7500 rpm for 40 min and second at 7000 rpm for 10 min; in both steps, the particles were resuspended in 60 mL of EtOH. This solution was kept to further use them as NSt seeds. The obtained AuNSt exhibit a maximum absorbance peak around 850 nm and a final Au concentration of 1.93 × 10⁻⁴ M.
Determination of [PVP] in Solution
It is important to note that, because the standard synthesis of AuNSt requires the use of a large excess of PVP, the appropriate cleaning of the NPs to be used as seeds is of paramount importance. For example, Figure S8 shows the LSPR variation for the three reactions following exactly the same synthetic protocol but with AuNSt at different cleaning levels. When the particles were used without cleaning, no LSPR shift was observed (Figure S8A). Further, even when the same cleaning protocol was followed (three cycles of centrifugation), severe disagreement was found within the LSPR blue-shift (Figure S8B,C), revealing that the PVP concentration was different for each sample even when the performed cleaning procedure has been apparently the same. Therefore, to ensure equal PVP concentration, the AuNSt were cleaned seven times, redispersing each of the centrifuged particles in a solution with well-defined PVP content. In this way, it is possible to know the PVP concentration of each solution without affecting the NP stability. The absorbance maximum of PVP is around 213 nm; however, after an exhaustive UV–vis study of this system, we choose to monitor the absorbance of 280 nm as it showed a good linear correlation with the PVP concentration (Figure S9). It is important to mention that this linear relation is highly dependent on the Au concentration in the solution. Therefore, different values are observed for different Au concentrations. Figure S9A,B shows the UV–vis spectra of two solutions of NSt at two different Au0 concentrations, where the PVP content was gradually changed. Figure S9C shows that, for both cases (and also for three extra different Au concentrations), there is a clear linear trend with the PVP concentration but different for each of the Au concentrations.
Influence of the PVP Concentration
Nine different AuNSt aliquots (2 mL) of the previously prepared AuNSt seeds were further cleaned prior to use by centrifugation at 7000 rpm for 10 min five times. After the first centrifugation, the particles were resuspended in EtOH, and the other four times were in an EtOH/PVP solution with a defined PVP concentration (0.05, 0.07, 0.12, 0.143, 0.17, 0.21, 0.28, 0.43, and 0.85 mM). The final volume was 2 mL for each sample. This cleaning procedure was performed to adjust the exact PVP content of the AuNSt solutions to avoid affecting the final PVP concentration during the overgrowth process. The influence of the PVP concentration was tested by adding 1.3 mL of the NSt seeds to EtOH/PVP solutions containing PVP concentrations ranging from 0.05 to 0.85 mM (the same as the seed solutions) at a fixed HAuCl4 concentration. Their growth kinetics was monitored by UV–vis. The final HAuCl4 and AuNStseeds concentrations used were 8.57 × 10⁻⁵ and 0.5 × 10⁻⁴ M, respectively. The [HAuCl4]/[AuNStseeds] was 1.7, and the [HAuCl4]/[PVP] was varied from 0.1 to 1.5.
Influence of the HAuCl4 Concentration
To test the influence of the HAuCl4 concentration, R2 was kept constant at 0.2 and the [HAuCl4]/[AuNSt] ratio was varied from 0.1, 0.2, 0.4, 0.6, 0.8, 1.0, to 1.5. The AuNSt seed concentration was kept constant at 1.24 × 10⁻⁴ M. Thus, HAuCl4 concentrations of 1.2 × 10⁻⁵, 2.4 × 10⁻⁵, 4.9 × 10⁻⁵, 7.4 × 10⁻⁵, 9.9 × 10⁻⁵, 12.4 × 10⁻⁵, and 18.6 × 10⁻⁵ M were used.
Tuning the λmax of AuNSt
To tune the λmax, 80 mL of Au stars with λmax at 870 nm was produced. After the synthesis, the obtained AuNSt were cleaned as previously described. After cleaning, the obtained AuNSt were prepared to have concentrations of PVP and Au0 of 4 × 10⁻⁴ and 1.24 × 10⁻⁴ M, respectively. Next, HAuCl4 was added to have a final concentration of 8 × 10⁻⁵ M. The solution was energetically mixed and then divided in fifteen different aliquots, 5 mL each, and left undisturbed. The evolution of the NSt was monitored by UV–vis with time and was stopped at the desired wavelength by the addition of 5 mL of PVP solution in EtOH (1.5 × 10⁻³ M). Next, the NSt solution was cleaned by centrifugation (7000 rpm, 10 min) and redispersed in 5 mL of a PVP/EtOH solution (2.5 × 10⁻⁴ M) to assure their stability over time.
Characterization
UV–vis spectroscopy (Thermo Scientific Evolution 201) and TEM (JEOL 1011 operating at 100 kV) were performed to characterize the optical response and size of the NPs. TEM samples were prepared by drying ethanolic suspensions on carbon–Formvar-coated 200 mesh copper grids.
Acknowledgments
This work was funded by the Spanish Ministerio de Economia y Competitividad (CTQ2017-88648R, RYC-2016-20331, and RYC-2015-19107), the Generalitat de Cataluña (2017SGR883), the Universitat Rovira i Virgili (2017PFR-URV-B2-02), and the Universitat Rovira i Virgili and Banco Santander (2017EXIT-08).
Supporting Information Available
The Supporting Information is available free of charge on the ACS Publications website at DOI: 10.1021/acsomega.8b02686.
TEM images, histograms, and UV–vis spectra of the different materials (PDF)
The authors declare no competing financial interest.
Supplementary Material
References
- Yu S.; Wilson A. J.; Kumari G.; Zhang X.; Jain P. K. Opportunities and Challenges of Solar-Energy-Driven Carbon Dioxide to Fuel Conversion with Plasmonic Catalysts. ACS Energy Lett. 2017, 2, 2058–2070. 10.1021/acsenergylett.7b00640. [DOI] [Google Scholar]
- Sivis M.; Pazos-Perez N.; Yu R.; Alvarez-Puebla R.; García de Abajo F. J.; Ropers C. Continuous-Wave Multiphoton Photoemission from Plasmonic Nanostars. Comm. Phys. 2018, 1, 13. 10.1038/s42005-018-0014-7. [DOI] [Google Scholar]
- a Ming T.; Chen H.; Jiang R.; Li Q.; Wang J. Plasmon-Controlled Fluorescence: Beyond the Intensity Enhancement. J. Phys. Chem. Lett. 2012, 3, 191–202. 10.1021/jz201392k. [DOI] [Google Scholar]; b Schlücker S. Surface-Enhanced Raman Spectroscopy: Concepts and Chemical Applications. Angew. Chem., Int. Ed. 2014, 53, 4756–4795. 10.1002/anie.201205748. [DOI] [PubMed] [Google Scholar]; c Neubrech F.; Huck C.; Weber K.; Pucci A.; Giessen H. Surface-Enhanced Infrared Spectroscopy Using Resonant Nanoantennas. Chem. Rev. 2017, 117, 5110–5145. 10.1021/acs.chemrev.6b00743. [DOI] [PubMed] [Google Scholar]; d Zhang Q.; Large N.; Wang H. Gold Nanoparticles with Tipped Surface Structures as Substrates for Single-Particle Surface-Enhanced Raman Spectroscopy: Concave Nanocubes, Nanotrisoctahedra, and Nanostars. ACS Appl. Mater. Interfaces 2014, 6, 17255–17267. 10.1021/am505245z. [DOI] [PubMed] [Google Scholar]
- Polo E.; Navarro Poupard M. F.; Guerrini L.; Taboada P.; Pelaz B.; Alvarez-Puebla R. A.; del Pino P. Colloidal Bioplasmonics. Nano Today 2018, 20, 58–73. 10.1016/j.nantod.2018.04.003. [DOI] [Google Scholar]
- Xin H.; Namgung B.; Lee L. P. Nanoplasmonic Optical Antennas for Life Sciences and Medicine. Nat. Rev. Mater. 2018, 3, 228–243. 10.1038/s41578-018-0033-8. [DOI] [Google Scholar]
- Myroshnychenko V.; Rodríguez-Fernández J.; Pastoriza-Santos I.; Funston A. M.; Novo C.; Mulvaney P.; Liz-Marzán L. M.; García de Abajo F. J. Modelling the Optical Response of Gold Nanoparticles. Chem. Soc. Rev. 2008, 37, 1792–1805. 10.1039/b711486a. [DOI] [PubMed] [Google Scholar]
- a Alvarez-Puebla R.; Liz-Marzán L. M.; García de Abajo F. J. Light Concentration at the Nanometer Scale. J. Phys. Chem. Lett. 2010, 1, 2428–2434. 10.1021/jz100820m. [DOI] [Google Scholar]; b Rodríguez-Lorenzo L.; Álvarez-Puebla R. A.; Pastoriza-Santos I.; Mazzucco S.; Stéphan O.; Kociak M.; Liz-Marzán L. M.; García de Abajo F. J. Zeptomol Detection through Controlled Ultrasensitive Surface-Enhanced Raman Scattering. J. Am. Chem. Soc. 2009, 131, 4616–4618. 10.1021/ja809418t. [DOI] [PubMed] [Google Scholar]; c Senthil Kumar P.; Pastoriza-Santos I.; Rodriguez-Gonzalez B.; Garcia de Abajo F. J.; Liz-Marzan L. M. High-Yield Synthesis and Optical Response of Gold Nanostars. Nanotechnology 2008, 19, e015606 10.1088/0957-4484/19/01/015606. [DOI] [PubMed] [Google Scholar]; d Shao L.; Susha A. S.; Cheung L. S.; Sau T. K.; Rogach A. L.; Wang J. Plasmonic Properties of Single Multispiked Gold Nanostars: Correlating Modeling with Experiments. Langmuir 2012, 28, 8979–8984. 10.1021/la2048097. [DOI] [PubMed] [Google Scholar]
- Mulvihill M. J.; Ling X. Y.; Henzie J.; Yang P. Anisotropic Etching of Silver Nanoparticles for Plasmonic Structures Capable of Single-Particle SERS. J. Am. Chem. Soc. 2010, 132, 268–274. 10.1021/ja906954f. [DOI] [PubMed] [Google Scholar]
- a Rodríguez-Lorenzo L.; Krpetic Z.; Barbosa S.; Alvarez-Puebla R. A.; Liz-Marzán L. M.; Prior I. A.; Brust M. Intracellular Mapping with SERS-Encoded Gold Nanostars. Integr. Biol. 2011, 3, 922–926. 10.1039/c1ib00029b. [DOI] [PubMed] [Google Scholar]; b Jimenez de Aberasturi D.; Serrano-Montes A. B.; Langer J.; Henriksen-Lacey M.; Parak W. J.; Liz-Marzán L. M. Surface Enhanced Raman Scattering Encoded Gold Nanostars for Multiplexed Cell Discrimination. Chem. Mater. 2016, 28, 6779–6790. 10.1021/acs.chemmater.6b03349. [DOI] [Google Scholar]
- Yuan H.; Fales A. M.; Vo-Dinh T. TAT Peptide-Functionalized Gold Nanostars: Enhanced Intracellular Delivery and Efficient NIR Photothermal Therapy Using Ultralow Irradiance. J. Am. Chem. Soc. 2012, 134, 11358–11361. 10.1021/ja304180y. [DOI] [PMC free article] [PubMed] [Google Scholar]
- Espinosa A.; Silva A. K. A.; Sánchez-Iglesias A.; Grzelczak M.; Péchoux C.; Desboeufs K.; Liz-Marzán L. M.; Wilhelm C. Cancer Cell Internalization of Gold Nanostars Impacts Their Photothermal Efficiency in Vitro and in Vivo: Toward a Plasmonic Thermal Fingerprint in Tumoral Environment. Adv. Healthcare Mater. 2016, 5, 1040–1048. 10.1002/adhm.201501035. [DOI] [PubMed] [Google Scholar]
- a Wu F.; Wen H. M.; Lavernia E. J.; Narayan J.; Zhu Y. T. Twin Intersection Mechanisms in Nanocrystalline FCC Metals. Mater. Sci. Eng., A 2013, 585, 292–296. 10.1016/j.msea.2013.07.063. [DOI] [Google Scholar]; b Zhu Y. T.; Wu X. L.; Liao X. Z.; Narayan J.; Kecskés L. J.; Mathaudhu S. N. Dislocation–Twin Interactions in Nanocrystalline FCC Metals. Acta Mater. 2011, 59, 812–821. 10.1016/j.actamat.2010.10.028. [DOI] [Google Scholar]; c Morla-Folch J.; Guerrini L.; Pazos-Perez N.; Arenal R.; Alvarez-Puebla R. A. Synthesis and Optical Properties of Homogeneous Nanoshurikens. ACS Photonics 2014, 1, 1237–1244. 10.1021/ph500348h. [DOI] [Google Scholar]
- a Khoury C. G.; Vo-Dinh T. Gold Nanostars for Surface-Enhanced Raman Scattering: Synthesis, Characterization and Optimization. J. Phys. Chem. C 2008, 112, 18849–18859. 10.1021/jp8054747. [DOI] [PMC free article] [PubMed] [Google Scholar]; b Barbosa S.; Agrawal A.; Rodriguez-Lorenzo L.; Pastoriza-Santos I.; Alvarez-Puebla R. A.; Kornowski A.; Weller H.; Liz-Marzan L. M. Tuning Size and Sensing Properties in Colloidal Gold Nanostars. Langmuir 2010, 26, 14943–14950. 10.1021/la102559e. [DOI] [PubMed] [Google Scholar]
- Plascencia-Villa G.; Bahena D.; Rodriguez A. R.; Ponce A.; Jose-Yacaman M. Advanced Microscopy of Star-Shaped Gold Nanoparticles and Their Adsorption-Uptake by Macrophages. Metallomics 2013, 5, 242–250. 10.1039/c3mt20202j. [DOI] [PMC free article] [PubMed] [Google Scholar]
- Pastoriza-Santos I.; Liz-Marzán L. M. N,N-Dimethylformamide as a Reaction Medium for Metal Nanoparticle Synthesis. Adv. Funct. Mater. 2009, 19, 679–688. 10.1002/adfm.200801566. [DOI] [Google Scholar]
- a Haaf F.; Sanner A.; Straub F. Polymers of N-Vinylpyrrolidone: Synthesis, Characterization and Uses. Polym. J. 1985, 17, 143. 10.1295/polymj.17.143. [DOI] [Google Scholar]; b Graf C.; Vossen D. L. J.; Imhof A.; van Blaaderen A. A General Method To Coat Colloidal Particles with Silica. Langmuir 2003, 19, 6693–6700. 10.1021/la0347859. [DOI] [PubMed] [Google Scholar]
- a Jana N. R.; Gearheart L.; Murphy C. J. Seed-Mediated Growth Approach for Shape-Controlled Synthesis of Spheroidal and Rod-like Gold Nanoparticles Using a Surfactant Template. Adv. Mater. 2001, 13, 1389–1393. . [DOI] [Google Scholar]; b Nikoobakht B.; El-Sayed M. A. Preparation and Growth Mechanism of Gold Nanorods (NRs) Using Seed-Mediated Growth Method. Chem. Mater. 2003, 15, 1957–1962. 10.1021/cm020732l. [DOI] [Google Scholar]; c Pietrobon B.; McEachran M.; Kitaev V. Synthesis of Size-Controlled Faceted Pentagonal Silver Nanorods with Tunable Plasmonic Properties and Self-Assembly of These Nanorods. ACS Nano 2009, 3, 21–26. 10.1021/nn800591y. [DOI] [PubMed] [Google Scholar]
- Carbó-Argibay E.; Rodríguez-González B.; Pacifico J.; Pastoriza-Santos I.; Pérez-Juste J.; Liz-Marzán L. M. Chemical Sharpening of Gold Nanorods: The Rod-to-Octahedron Transition. Angew. Chem., Int. Ed. 2007, 46, 8983–8987. 10.1002/anie.200703259. [DOI] [PubMed] [Google Scholar]
- a Brown M. E. The Prout-Tompkins Rate Equation in Solid-State Kinetics. Thermochim. Acta 1997, 300, 93–106. 10.1016/S0040-6031(96)03119-X. [DOI] [Google Scholar]; b Mariño-Lopez A.; Sousa-Castillo A.; Blanco-Formoso M.; Furini L. N.; Rodríguez-Lorenzo L.; Pazos-Perez N.; Guerrini L.; Pérez-Lorenzo M.; Correa-Duarte M. A.; Alvarez-Puebla R. A. Microporous Plasmonic Capsules as Stable Molecular Sieves for Direct SERS Quantification of Small Pollutants in Natural Waters. ChemNanoMat 2018, 4, 1. 10.1002/cnma.201800355. [DOI] [Google Scholar]
- Xia X.; Zeng J.; Oetjen L. K.; Li Q.; Xia Y. Quantitative Analysis of the Role Played by Poly(vinylpyrrolidone) in Seed-Mediated Growth of Ag Nanocrystals. J. Am. Chem. Soc. 2012, 134, 1793–1801. 10.1021/ja210047e. [DOI] [PMC free article] [PubMed] [Google Scholar]
- Nakazato Y.; Taniguchi K.; Ono S.; Eitoku T.; Katayama K. Formation Dynamics of Gold Nanoparticles in Poly(vinylpyrrolidone) and other Protective Agent Solutions. Phys. Chem. Chem. Phys. 2009, 11, 10064–10072. 10.1039/b915353e. [DOI] [PubMed] [Google Scholar]
- Alvarez-Puebla R. A. Effects of the Excitation Wavelength on the SERS Spectrum. J. Phys. Chem. Lett. 2012, 3, 857–866. 10.1021/jz201625j. [DOI] [PubMed] [Google Scholar]
- a Haynes C. L.; Van Duyne R. P. Plasmon-Sampled Surface-Enhanced Raman Excitation Spectroscopy. J. Phys. Chem. B 2003, 107, 7426–7433. 10.1021/jp027749b. [DOI] [PubMed] [Google Scholar]; b McFarland A. D.; Young M. A.; Dieringer J. A.; Van Duyne R. P. Wavelength-Scanned Surface-Enhanced Raman Excitation Spectroscopy. J. Phys. Chem. B 2005, 109, 11279–11285. 10.1021/jp050508u. [DOI] [PubMed] [Google Scholar]
- a Enustun B. V.; Turkevich J. Coagulation of Colloidal Gold. J. Am. Chem. Soc. 1963, 85, 3317–3328. 10.1021/ja00904a001. [DOI] [Google Scholar]; b Turkevich J.; Stevenson P. C.; Hillier J. A Study of the Nucleation and Growth Processes in the Synthesis of Colloidal Gold. Discuss. Faraday Soc. 1951, 11, 55–75. 10.1039/df9511100055. [DOI] [Google Scholar]
- Aldeanueva-Potel P.; Carbó-Argibay E.; Pazos-Pérez N.; Barbosa S.; Pastoriza-Santos I.; Alvarez-Puebla R. A.; Liz-Marzán L. M. Spiked Gold Beads as Substrates for Single-Particle SERS. ChemPhysChem 2012, 13, 2561–2565. 10.1002/cphc.201101014. [DOI] [PubMed] [Google Scholar]
Associated Data
This section collects any data citations, data availability statements, or supplementary materials included in this article.