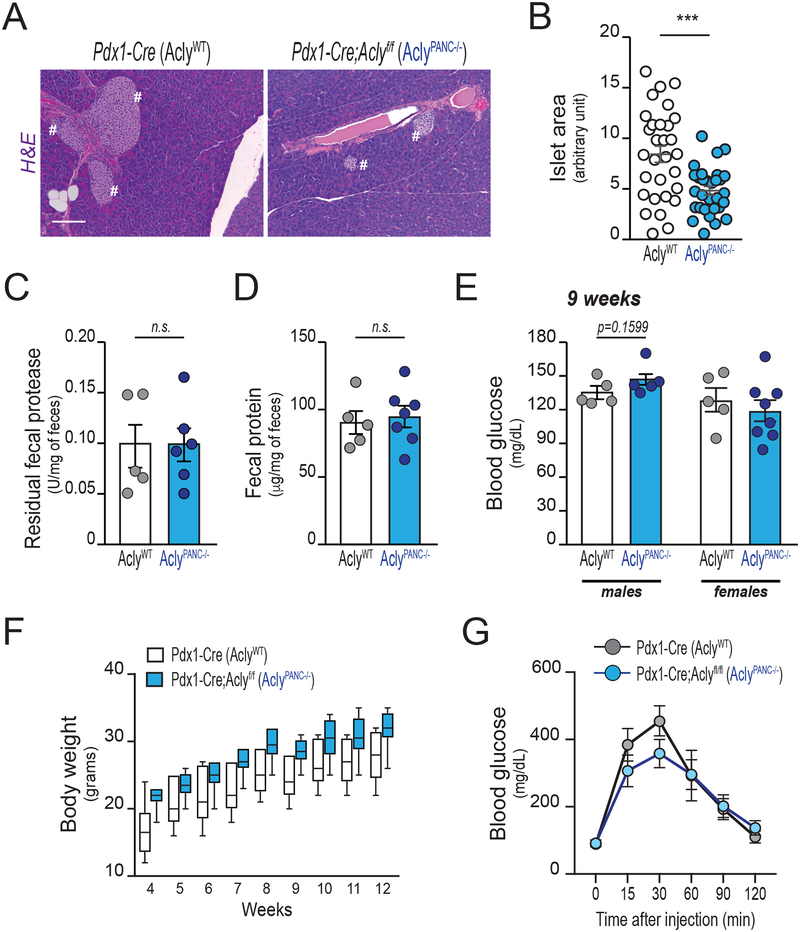
Figure 3: Acly deficiency in the murine pancreas does not cause overt metabolic abnormalities.
All panels depict characterization of age-matched Pdx1-Cre (AclyWT) and Pdx1-Cre;Aclyf/f (AclyPANC−/−) littermate mice (n=12, each group, unless otherwise reported). A, Hematoxylyn and eosin (H&E) staining of pancreata at 13 weeks of age (Representative images). Pound signs denote islets of Langerhans. Scale bars, 100 μm. B, Langerhans’ islets size, manually measured using ImageJ (6 slices per pancreas, each 50 μm spaced, were analyzed; n=5 mice per group). Each dot shows average islet size for each section analyzed (30 slides per group). Error bars show mean +/− SEM (***, p<0.001). C-D, fecal matter was harvested at 10 weeks of age from individually housed mice (n=6, each group). Fecal protease activity (C) and total residual protein content (D), normalized against fecal weight, mean +/− SEM. Each dot represents 1 mouse. E, blood glucose levels in male (left) and female (right) mice after overnight fast, mean +/− SEM. Each dot represents 1 mouse. F, body weight from age 4–12 weeks in male mice (n=5, each group). Boxes show 75% CI, lines show median, minimum, maximum. Difference between genotypes is not significant (ANOVA with Tukey-Kramer adjustment for multiple comparisons; p=0.9962). See Supplementary Figure 3 for data from female mice. G, Glucose tolerance test (GTT) on 10-week-old male mice (n=5, each group), mean +/− SEM.

