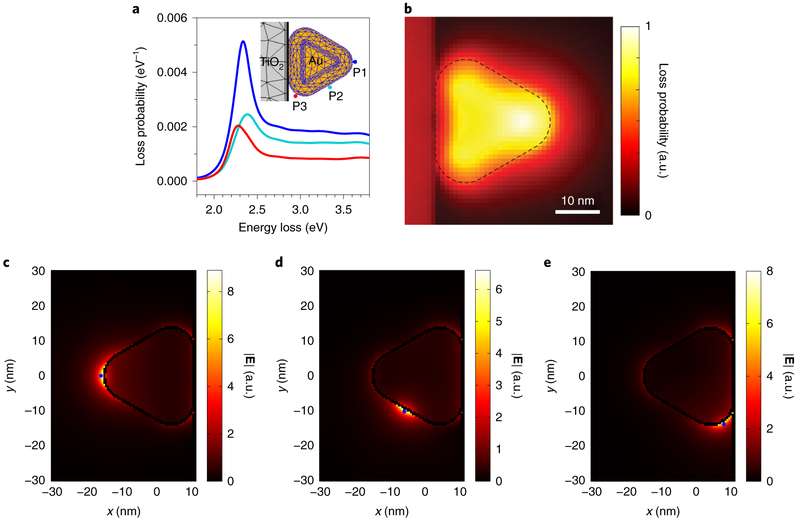
Fig. 2 ∣. Simulated electron-energy loss probability and induced electric field originating from electron-beam-excited LSP resonance on a Au nanoprism on TiO2 in a cantilevered configuration.
a, Simulated electron energy-loss probability spectra of the LSP resonance of a cantilevered Au nanoprism on a TiO2 particle associated with the aloof excitation locations marked in the inset. b, Map obtained by summing the simulated loss probability (in the range between 1.8 eV and 3.8 eV, with 0.01 eV resolution), showing the highest loss probability near the cantilevered short edge, either on or off the particle. The contrast represents the normalized loss probability from 0 to 1 (the maximum value observed). The dashed outline indicates the Au nanoprism edges. c–e, The LSP electric field amplitude simulated using the electron beam locations as marked (blue points) at P1 (c), P2 (d) and P3 (e) as well as the correlated resonance energies, indicating that the maximum LSP electric field amplitude (resonance antinode) is located near the cantilevered nanoprism corner when excited by the electron beam at P1.

