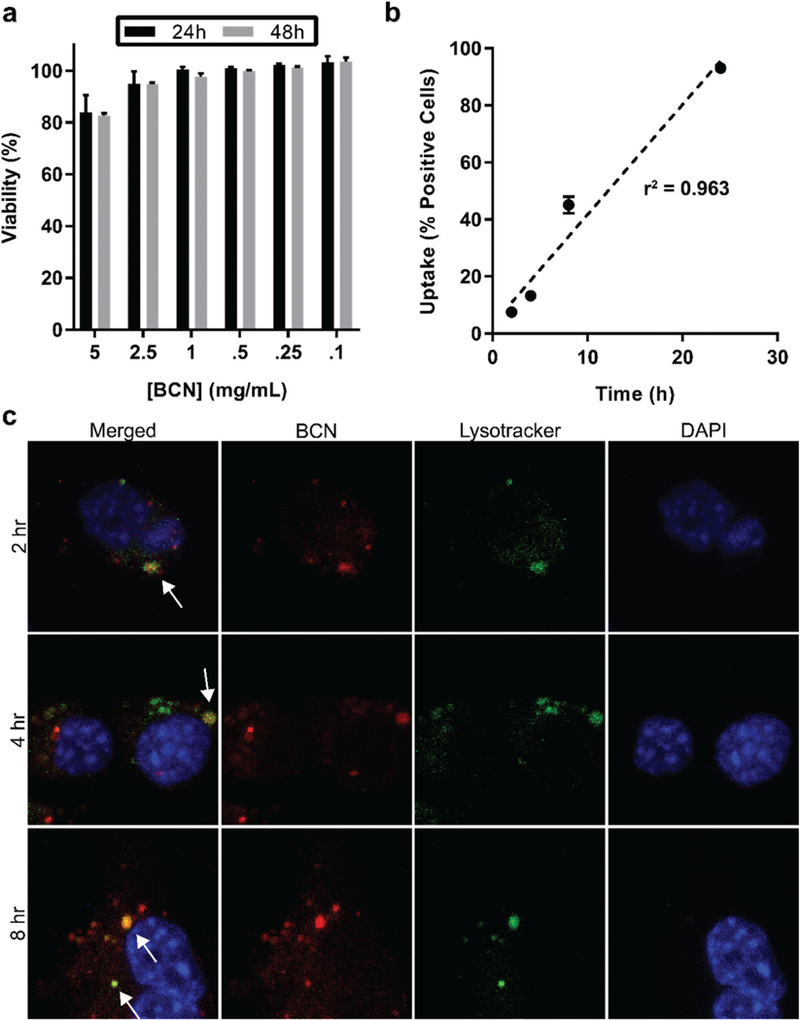
Fig. 4.

Uptake of BCNs and effect on cell viability. (a) MTT assay of RAW 264.7 macrophages incubated with BCNs for 24 or 48 hours at different concentrations. Error bars represent SD, n = 3. (b) Flow cytometric analysis of BCN uptake by RAW macrophages at different timepoints of incubation, error bars represent SD, n = 3. (c) Confocal images of macrophages stained with lysosomal dye Lysotracker (green) and DNA dye DAPI (blue) following incubation with Texas Red labeled BCNs (red) for 2, 4, or 8 h. White arrows in the merged image point to examples of colocalization of Lysotracker and Texas Red signals, demonstrating endolysosomal uptake of BCNs.
