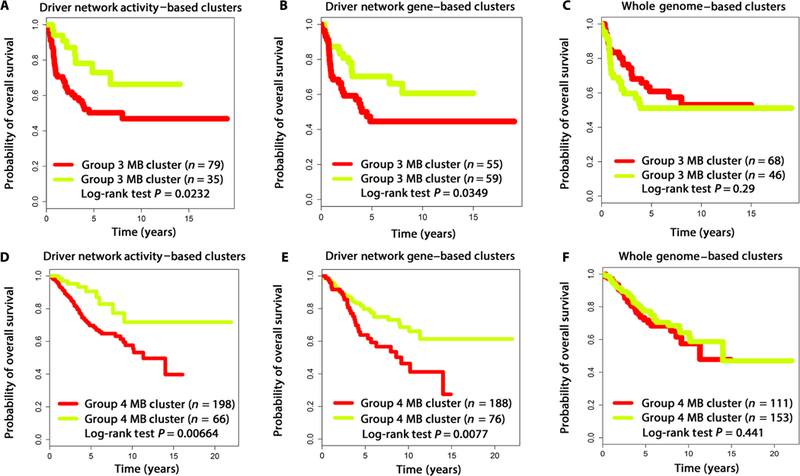
Fig. 2. Correlation of driver network activity with patient with groups 3 and 4 MB overall survival.

(A) Driver network activity– and (B) driver network gene–based clusters for group 3 MB correlated with differences in patient survival (P = 0.0232 and P = 0.0349, respectively). (C) Genome-wide mRNA expression–based clusters for group 3 MB were not associated with significant differences in patient survival (P = 0.290). (D) Driver network activity– and (E) driver network gene–based clusters for group 4 MB correlated with differences in patient survival (P = 0.00664 and P = 0.0077, respectively). (F) Genome-wide gene expression–based clusters for group 4 MB were not associated with significant differences in survival (P = 0.441).
