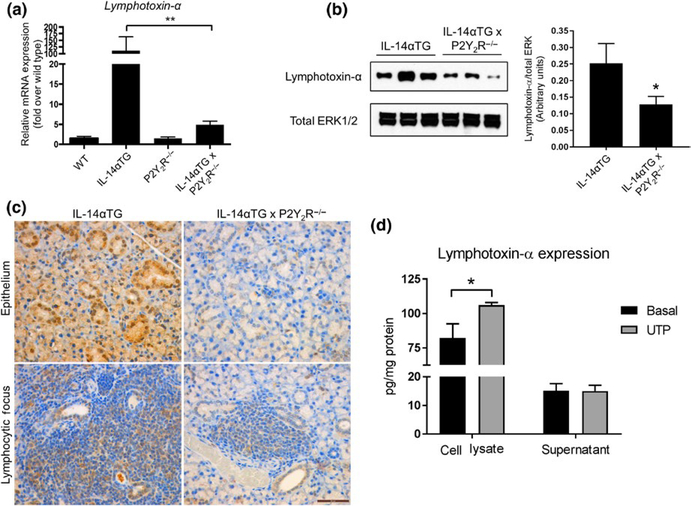
FIGURE 5.
Lymphotoxin-α expression in submandibular glands (SMGs) from IL-14αTG, IL-14αTG × P2Y2R−/−, wild-type C57BL/6, and P2Y2R−/− mice. Lymphotoxin-α mRNA expression was determined by (a) RT-PCR analysis of cDNA derived from whole SMGs of 9-month-old mice. Data are means ± SEM for wild-type (n = 5), IL-14αTG (n = 8), P2Y2R−/− (n = 7), and IL-14αTG × P2Y2R−/− (n = 18) mice, where ** indicates p < .01. (b) Western analysis and quantification of Lymphotoxin-α protein expression in SMG lysates from 9-month-old mice. Data are means ± SEM for IL-14αTG (n = 11) and IL-14αTG × P2Y2R−/− (n = 11) mice, where * indicates p < .05. (c) Immunohistochemical analysis of Lymphotoxin-α expression in epithelial cells (top panels) and lymphocytic foci (bottom panels) in SMGs from 9-month-old IL-14αTG mice (left panels) and age-matched IL-14αTG × P2Y2R−/− mice (right panels). Immunohistochemistry images are representative of n = 6 samples for each mouse genotype; scale bar = 50 μm. (d) Primary SMG cells from 9-month-old IL-14αTG mice were treated with (gray bars) or without (black bars) 100 μ mol L−1 UTP for 24 hr, and Lymphotoxin-α expression in cell lysates and supernatants was determined by ELISA. Data are means ± SEM for IL-14αTG mice from n = 3 experiments, where * indicates p < .05

