
Figure 7.
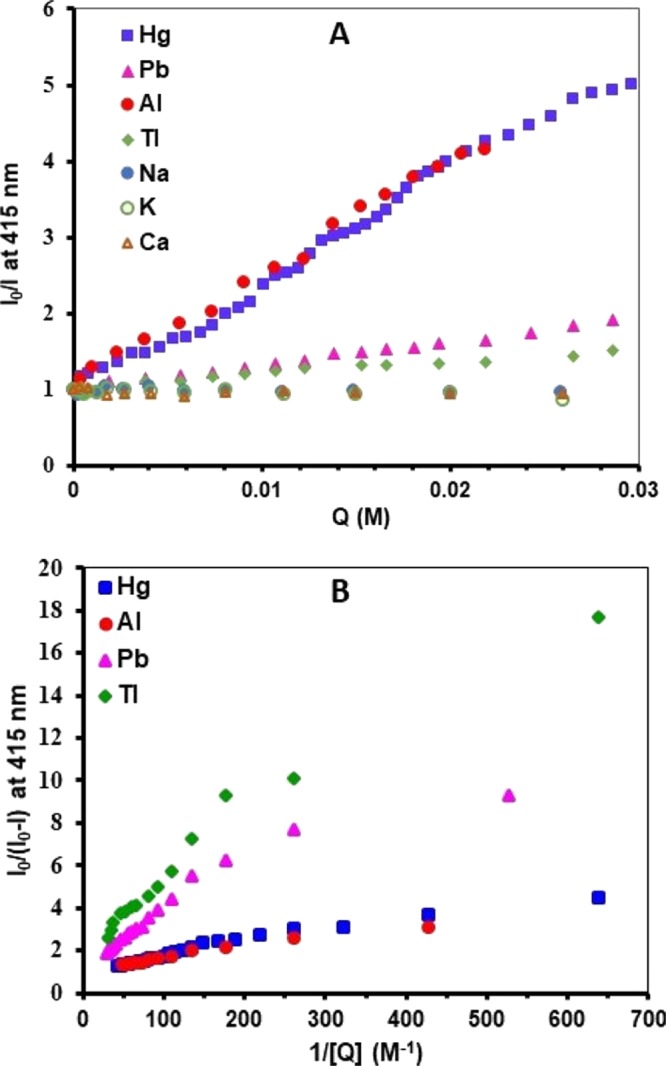
Stern–Volmer (A) and Benesi–Hildebrand (B) plots for the change in the emission (λemi = 415 nm) of Azo-Py upon titrating with the different metal ions.
Official websites use .gov
A
.gov website belongs to an official
government organization in the United States.
Secure .gov websites use HTTPS
A lock (
) or https:// means you've safely
connected to the .gov website. Share sensitive
information only on official, secure websites.
Stern–Volmer (A) and Benesi–Hildebrand (B) plots for the change in the emission (λemi = 415 nm) of Azo-Py upon titrating with the different metal ions.