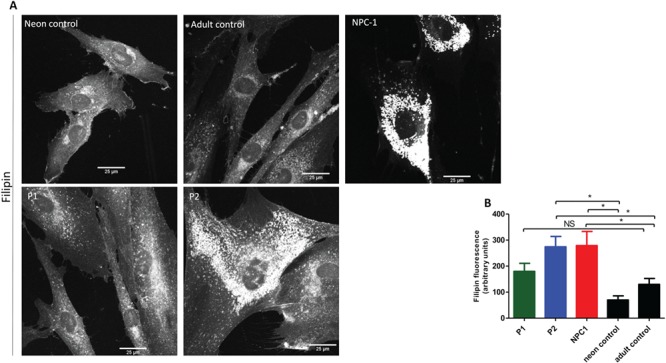
Figure 7.

Cholesterol accumulation in patients with MPS plus syndrome. (A) Representative confocal images of patients P1, P2, NPC-1 patient and control fibroblasts stained for unesterified cholesterol using filipin. (B) Quantification of CTCF was performed in n ≥ 10 cells per each cell type. Data presented as mean ± SEM. *, P < 0.05 in two-tailed unpaired Student’s t-test; NS, not significant.
