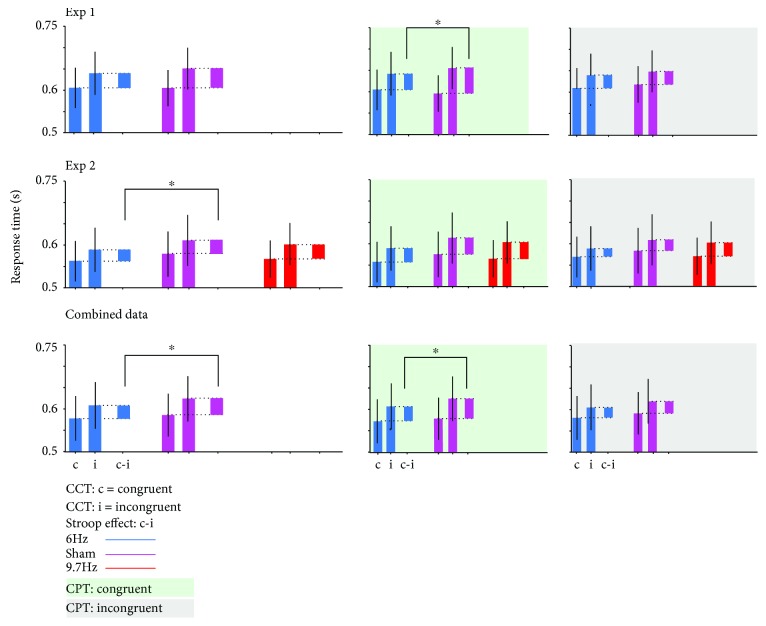
Figure 3.
Effect of stimulation on response time. The response times for congruent and incongruent trials and the time difference between these (Stroop effect) are plotted for each stimulation condition individually for all trials in the left panels. In the middle panels, only data of trials which were preceded by a congruent trial are displayed; in the right panels, only for trials preceded by an incongruent trial. Experiment 1 (first row): CCT (size of Stroop effect) and stimulation interact significantly in trials preceded by congruent trials. Experiment 2 (middle row): the interaction CCT x stimulation is significant for all trials but not for the data subsets differentiated by the preceding trial. The active control stimulation in the alpha range did not change the interaction between stimulation and CCT. Combined dataset of both experiments (last row): the interaction between stimulation and CCT is significant across all trials. The significant interaction for trials preceded by congruent trials underlies the effect across all trials. All data is plotted including the 95% confidence interval.

