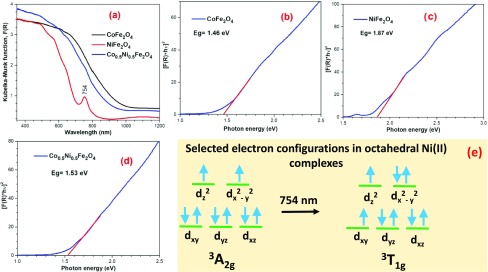
Figure 5.
(a) Kubelka–Munk plots (derived from DRS spectra) for the CoFe2O4-6, NiFe2O4-6, and Co0.5Ni0.5Fe2O4-6 NPs and (b–d) their corresponding Tauc’ plots to determine their bandgaps. (e) Sketch of the d orbitals in the ground and an excited electron configuration presents in octahedral Ni(II) complexes.51

