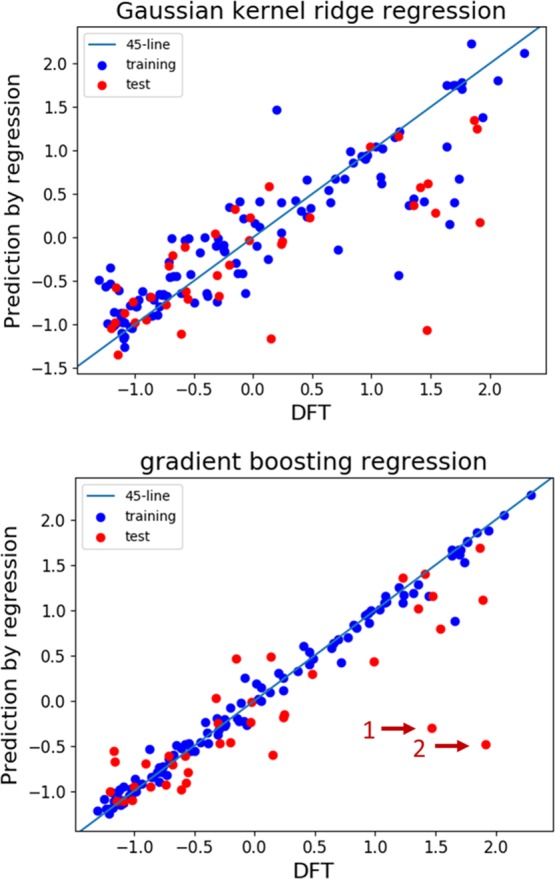
Figure 4.

Machine learning and prediction of reduction potentials by two regression models with standardized data: GKRR with optimized hyperparameters, α = 0.0868 and γ = 0.0152 (top), and GBR with two outliers, designated by arrows (bottom). Blue and red circles correspond to the training data and test data, respectively. Note that the axes are standardized.
