
Figure 6.
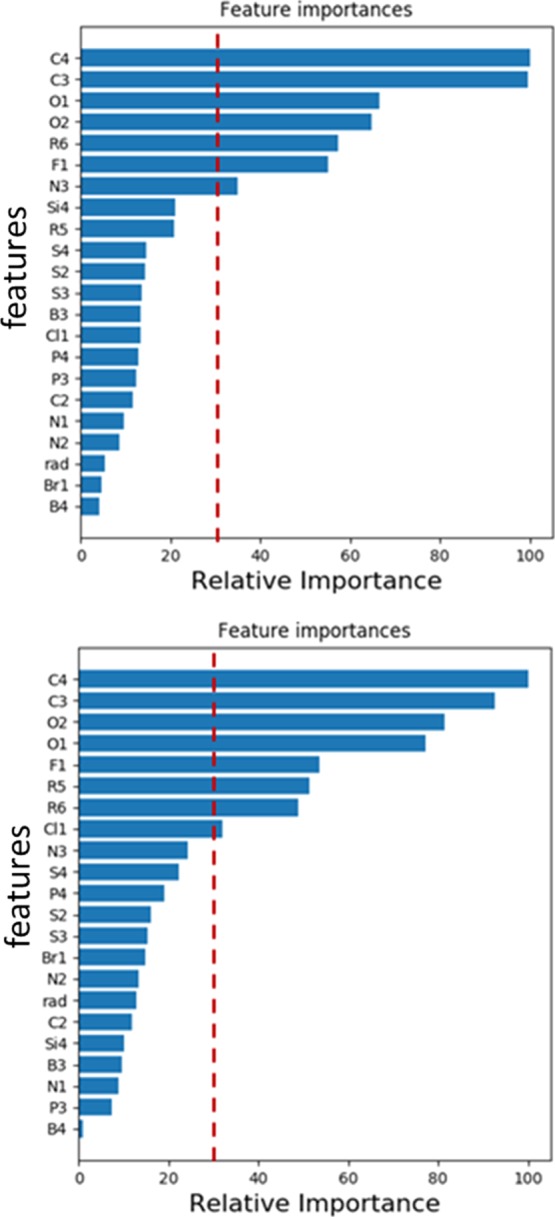
Relative feature importance in GBR models. Oxidation potential (top) and reduction potential (bottom). Dotted vertical lines represent a relative importance of 30%.
Official websites use .gov
A
.gov website belongs to an official
government organization in the United States.
Secure .gov websites use HTTPS
A lock (
) or https:// means you've safely
connected to the .gov website. Share sensitive
information only on official, secure websites.
Relative feature importance in GBR models. Oxidation potential (top) and reduction potential (bottom). Dotted vertical lines represent a relative importance of 30%.