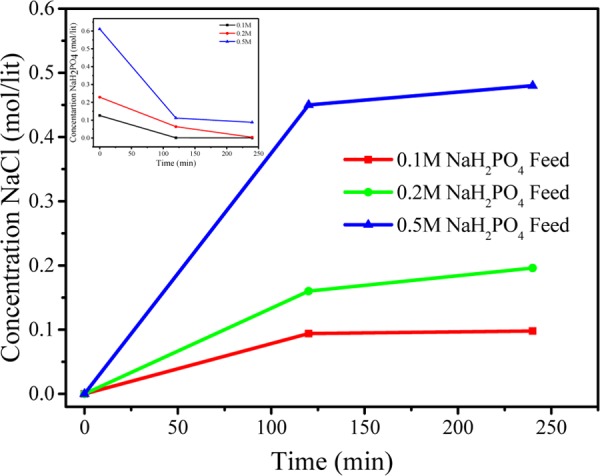
Figure 13.

Change in concentration of NaCl with time, with different feed concentrations of KCl and NaH2PO4 during metathesis electrodialysis (MED) process at 2 V per cell pair applied potential.

Change in concentration of NaCl with time, with different feed concentrations of KCl and NaH2PO4 during metathesis electrodialysis (MED) process at 2 V per cell pair applied potential.