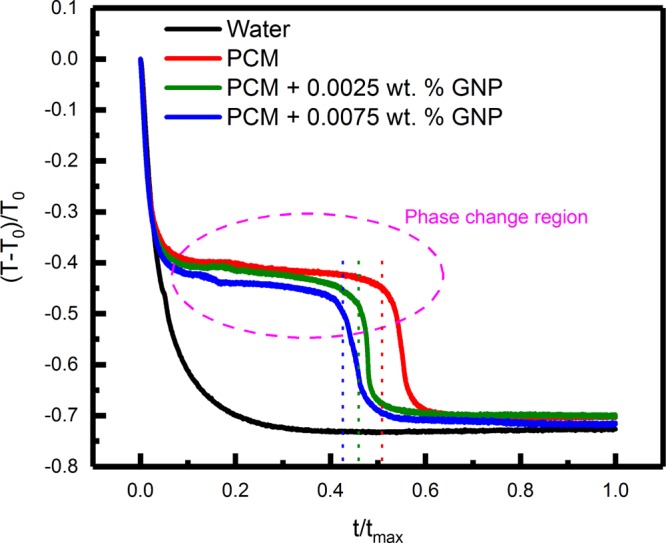
Figure 11.

Variation of the normalized temperature difference [(T – T0)/T0, where T0 is the initial temperature] as a function of normalized time (t/tm, where tm is the maximum observation time = 2000 s) for water, PCM without any nanoinclusions, and PCM loaded with 0.0025 and 0.0075 wt % GNP nanoinclusions. The presence of phase transition regions for the PCM (with or without nanoinclusions) is also indicated in the figure.
