Figure 2.
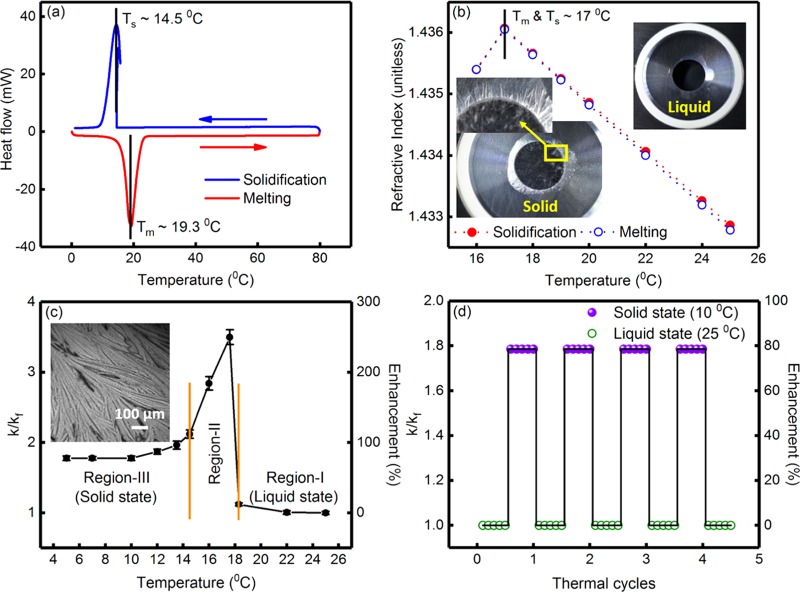
(a) Heat flow curves, during solidification and melting of the PCM (hexadecane), obtained from differential scanning calorimetry studies. The solidification (Ts) and melting (Tm) temperatures were ∼14.5 and 19.3 °C, respectively, as indicated in the figure. (b) The variation of refractive index of the PCM as a function of temperature during solidification and melting. The phase transition temperature was ∼17 °C. (Inset) typical photographs of the PCM in the liquid and solid states. The presence of needlelike microstructures and cracks in the solidified pellet of the PCM is clearly discernible. (c) Variation of k/kf and percentage enhancement in thermal conductivity, as a function of temperature, for the PCM, without any nanoinclusions. Here, k and kf indicate the temperature-dependent thermal conductivity of the PCM and the thermal conductivity of the PCM at T = 25 °C (=0.140 ± 0.002 W m–1 K–1), respectively. The variation of k/kf can be divided into three regions, viz., region-I (liquid state), region-II (phase transition), and region-III (solid state). (Inset) optical phase contrast microscopy image of the PCM in solid state, where the needlelike microstructure is clearly discernible. (d) Variation of k/kf and percentage enhancement in thermal conductivity during thermal cycling of the PCM, without any nanoinclusions.

