Figure 8.
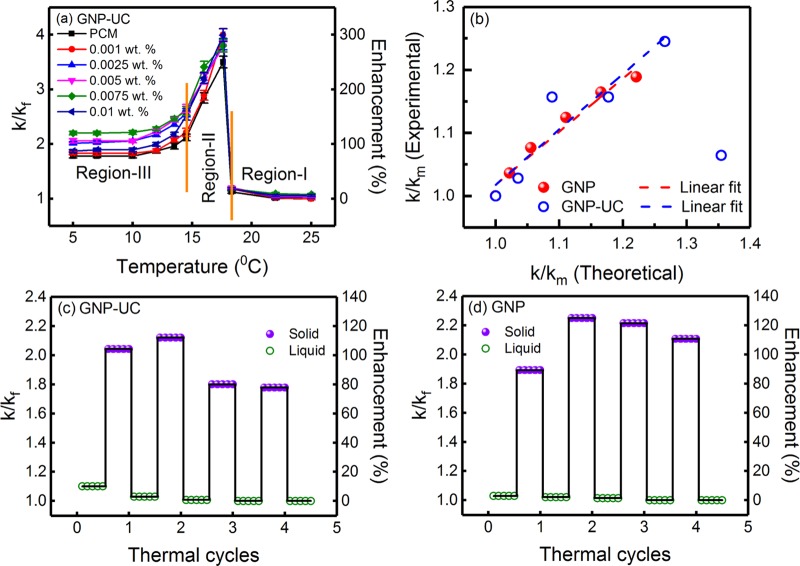
(a) Variation of k/kf and percentage enhancement in thermal conductivity as a function of temperature for the PCM loaded with five different concentrations of uncoated GNPs (GNPs-UC). For comparison, thermal conductivity variation of the PCM, without any nanoinclusion, is also shown in the figure. The variation of k/kf can be divided into three regions, viz., region-I (liquid state), region-II (phase transition), and region-III (solid state). (b) Variation of experimentally measured k/km as a function of theoretically calculated k/km values for the PCM loaded with various concentrations of oleic acid-functionalized GNPs and uncoated GNPs (GNPs-UC). Here, km indicates the thermal conductivity of the PCM, without any inclusions, in the solid state. The experimental and theoretical data were found to be linearly correlated, and the linear regression analyses are also shown in the figure. The errors associated with the theoretical values were less than ±5%. Variation of k/kf and percentage enhancement in thermal conductivity during thermal cycling of the PCM loaded with 0.005 wt % (c) uncoated GNPs (GNPs-UC) and (d) oleic acid-functionalized GNPs.

