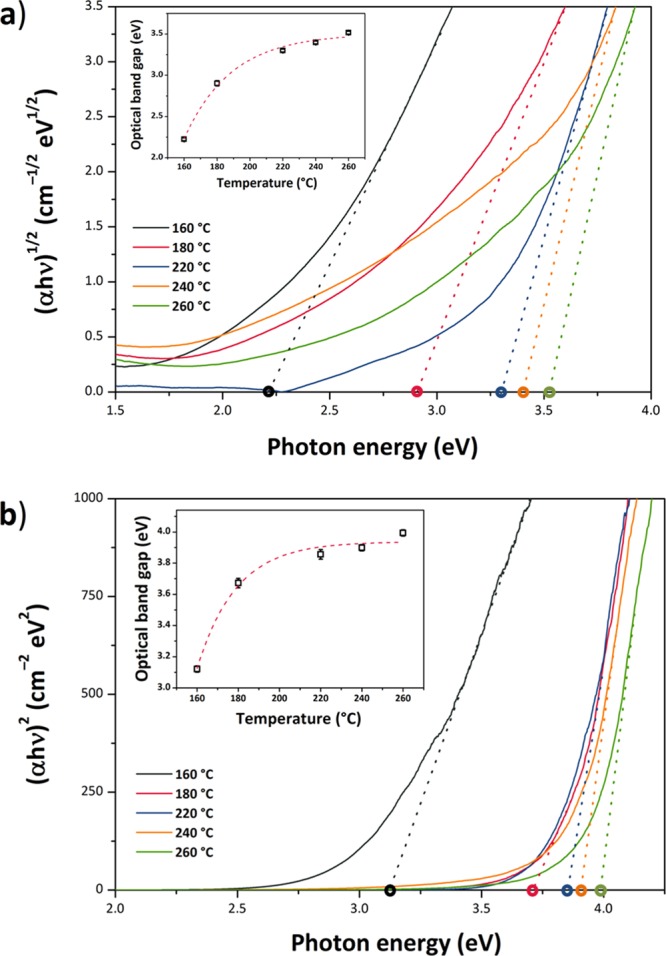
Figure 13.

Plots of the Kubelka–Munk function vs photon energy of the specimens synthesized at different temperatures showing the optical Eg estimated using the Tauc procedure. The dashed lines represent the x-axis intercept of the line tangent to the inflection point for each dataset. (a) Indirect Eg model, [F(R∞)hν]1/2, γ = 2. The insets show the systematic changes in Eg with increasing synthesis temperature and resulting NP size. (b) Directly allowed Eg model—[F(R∞)hν]2, γ = 1/2; the red dashed lines are drawn as a guide for the eye, showing an approximately exponential trend for the evolution of the optical Eg with the increase in the synthesis temperature.
