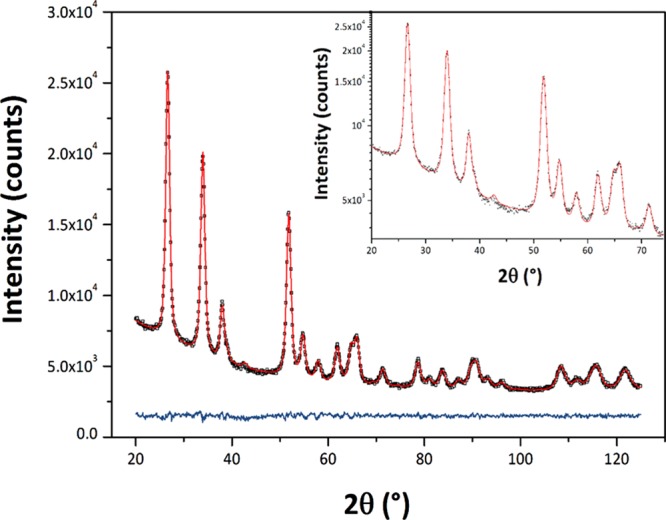
Figure 2.

Typical output of the WPPM modeling protocol applied to the observed X-ray diffraction pattern of a specimen synthesized at 220 °C. The black open squares represent the observed data, and the red continuous line represents the refined fit. The blue continuous line below shows the difference between observed and calculated profile. The log-scale plot (up to 75° 2θ) shown in the inset highlights details in the peak tail and background region.
