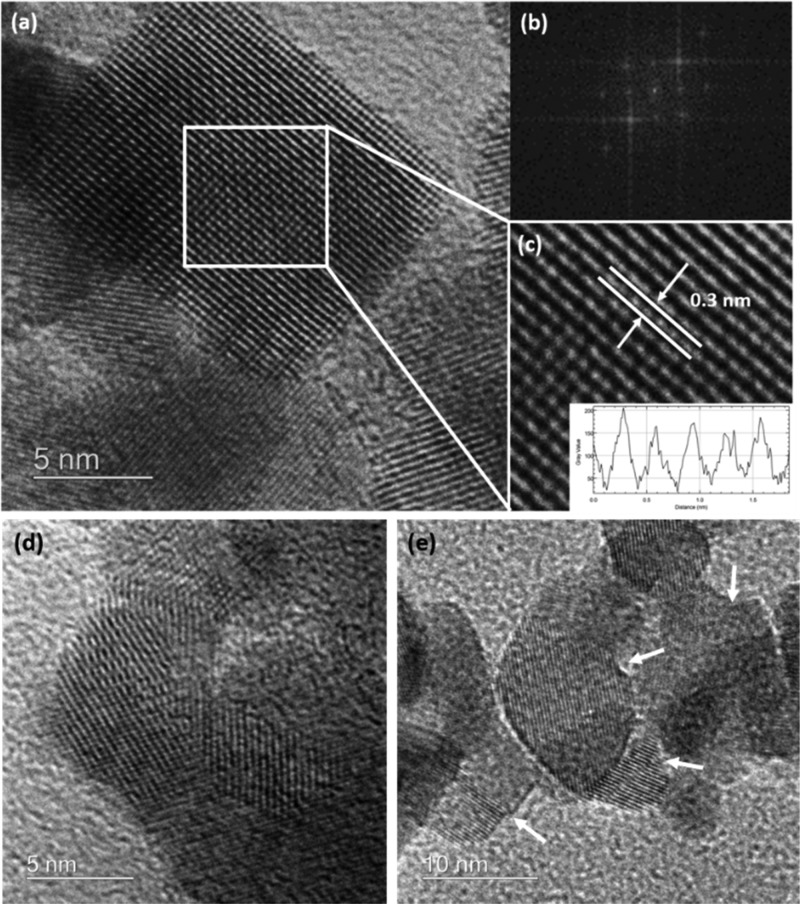
Figure 6.
(a) HRTEM image of a SnO2 sample prepared at 180 °C along with (b) its Fourier transform; (c) detail of the image showing lattice fringes with spacing ∼0.3 nm corresponding to the c axis dimension of rutile structured SnO2. Inset: Atomic density plot profile highlighting the spacing between lattice fringes; (d,e) HRTEM images showing the presence of screw and edge dislocations within NPs from this sample.

