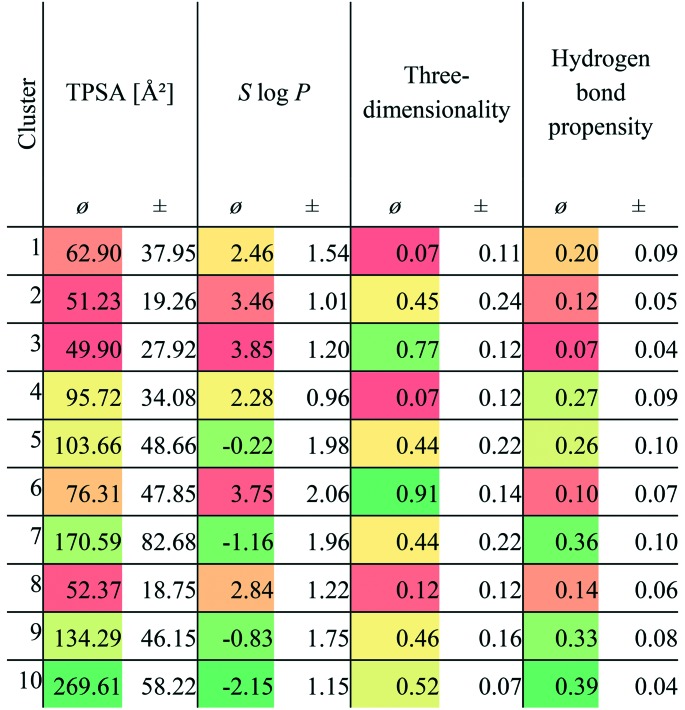
Table 1. Mean (ø) TPSA, S log P, three-dimensionality, and hydrogen bond propensities of the ligands of the similar binding site pairs (active pairs). The standard deviation (±) for all descriptors is also given. A color gradient ranging from green to yellow to red was applied. Green is used for the highest values in the case of TPSA, three-dimensionality, and hydrogen bond propensity. For the S log P descriptors, the lowest values are colored green.

|
