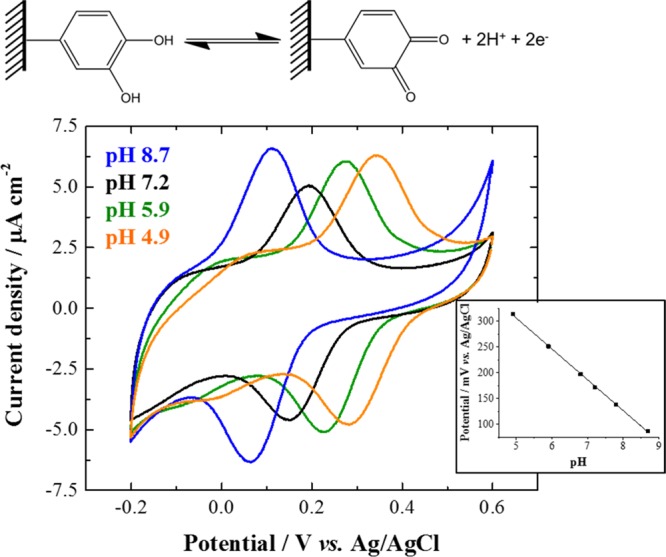
Figure 3.

Grafted catechol redox probe. Top: Schematic of the grafted quinone/hydroquinone redox couple. Bottom: Cyclic voltammograms (third cycle shown) recorded at 20 mV s–1 on catechol-modified glassy carbon electrode in 10 mM phosphate buffer aqueous electrolyte successively at pH 7.2 (black line), pH 8.7 (blue line), pH 5.9 (green line), and pH 4.9 (orange line) under inert atmosphere (Ar). Inset: pH dependence of the apparent normal potential of the grafted catechol with the corresponding linear regression analysis: y = −59.8x + 605, R2 = 0.9994.
