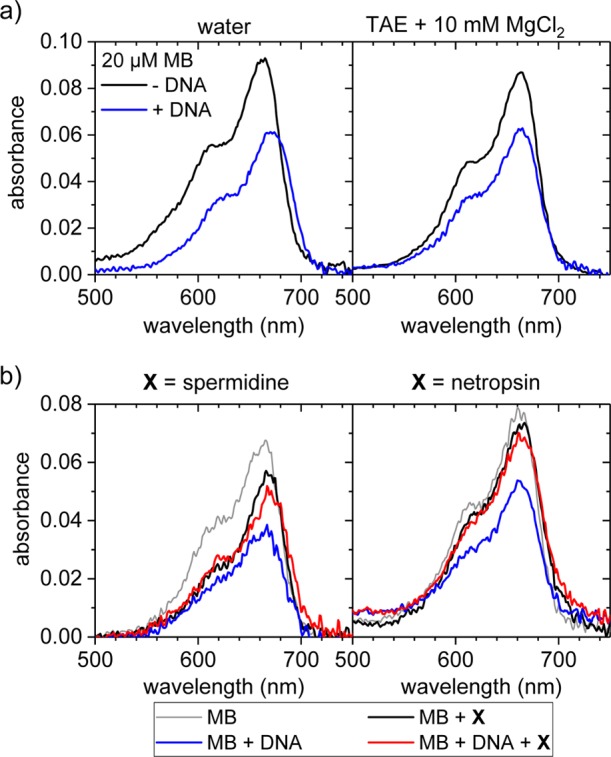
Figure 1.

(a) UV–vis absorbance spectra of 20 μM MB with and without genomic dsDNA from salmon testes in water and MgCl2-containing TAE buffer. DNA concentrations were 13 μM (water) and 11 μM (TAE + 10 mM MgCl2) in phosphates. In order to enhance the signal-to-noise ratio and detect even small bathochromic shifts, the shown spectra have been averaged over 10 individual absorbance measurements. Individual spectra can be found in the Supporting Information. (b) UV–vis spectra of the competition between 20 μM MB and 500 μM spermidine (left) and netropsin (right), respectively, in 1× TAE buffer supplemented with 10 mM MgCl2. The spectra of the spermidine-containing samples exhibited a broad background which has been subtracted in the above plot. The concentration of the genomic dsDNA was 308 μM in phosphates.
