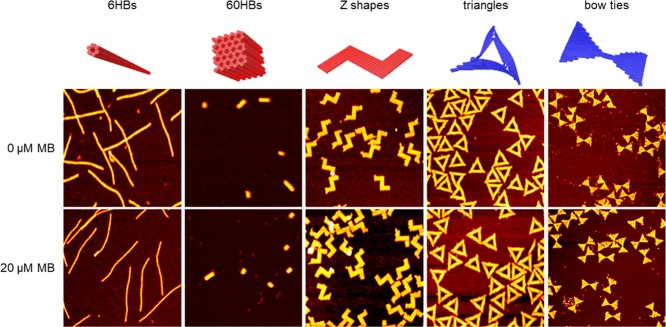
Figure 2.
CanDo70,71 simulations and AFM images (1 × 1 μm2) of 6HBs (height scales 4.5 nm), 60HBs (height scales 12 nm), Z-shaped DNA origami (height scales 3 nm), triangles (height scales 3 nm), and bow ties (height scales 2 nm) before and after exposure to 20 μM MB. The color coding in the CanDo simulations indicates the lattice type (red—honeycomb, blue—square).

