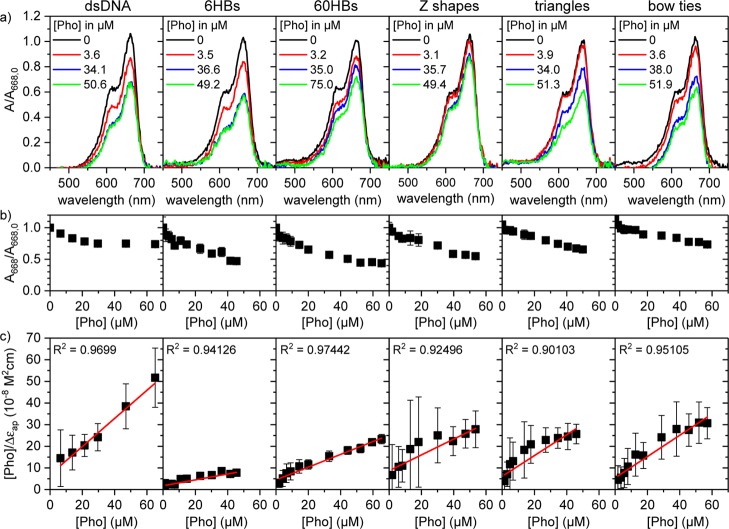
Figure 3.
(a) Representative UV–vis spectra of 20 μM MB in 1× TAE buffer containing 10 mM MgCl2 and different phosphate concentrations of dsDNA and different DNA origami nanostructures, respectively. The spectra are normalized to the absorbance at 668 nm in the absence of any DNA. (b) Representative normalized MB absorbance at 668 nm as a function of phosphate concentration. (c) Corresponding binding isotherms. The solid red lines in (c) are linear fits to the data that have been used for the determination of Kd values. R2 values of the fits are given in the plots. Error bars in (b,c) represent standard deviations obtained by averaging over five individual measurements. For Kd determination, these concentration-dependent measurements have been repeated at least once (see Methods).

