Figure 4.

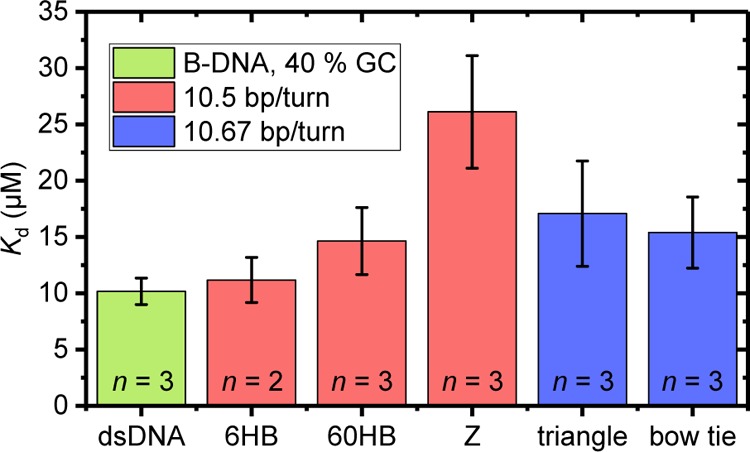
Determined Kd values for the investigated DNA structures. Values are presented as averages over n independent concentration series with the standard error of the mean as error bars (see Methods).

Determined Kd values for the investigated DNA structures. Values are presented as averages over n independent concentration series with the standard error of the mean as error bars (see Methods).