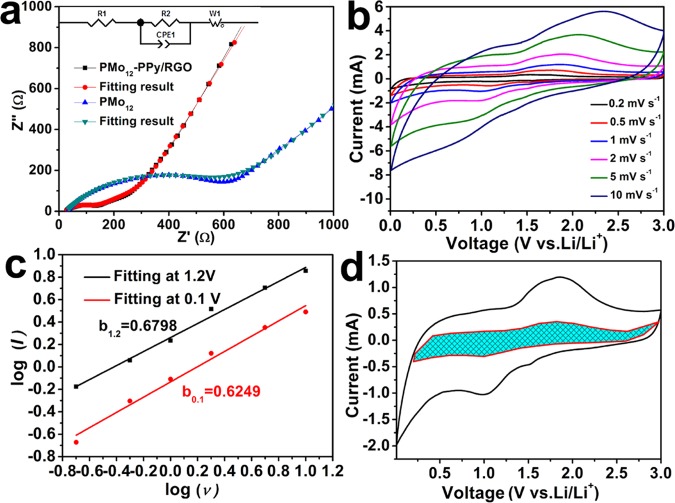
Figure 3.
(a) Nyquist plots of PMo12-–PPy/RGO and microcrystal PMo12 electrodes after three cycles. (b) CV curves of PMo12–PPy/RGO at various scan rates. (c) The b-value determination of 1.2 and 0.1 V cathodic current. (d) Capacitive-controlled charge storage contributions separated by cyclic voltammogram at 5 mV s–1 scan.

