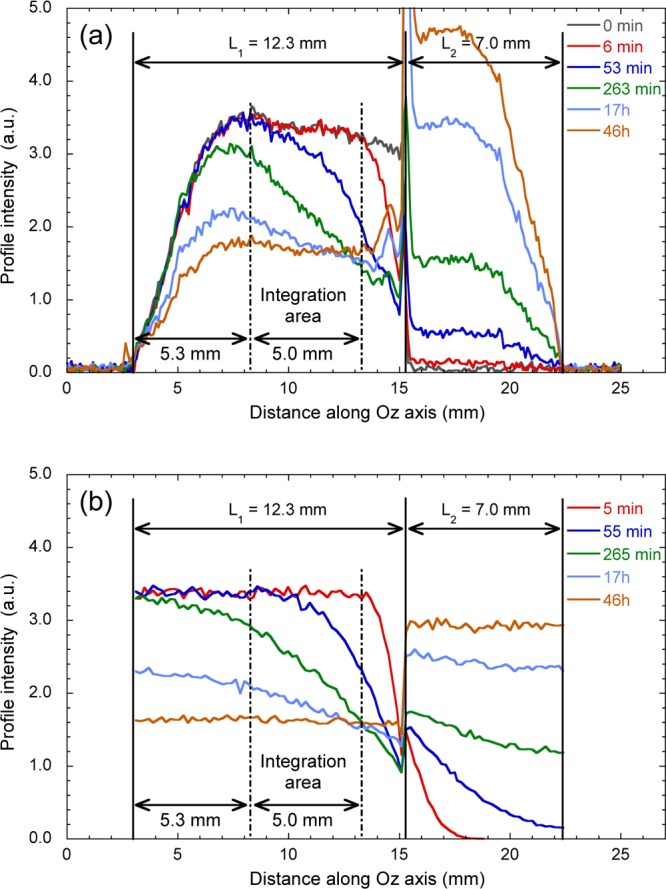
Figure 6.

Time evolution of the water concentration profiles: (a) measured by magnetic resonance imaging after the addition of bulk heavy water on the top of the water saturated sample and (b) obtained by numerical simulations of Brownian dynamics (see the text).
