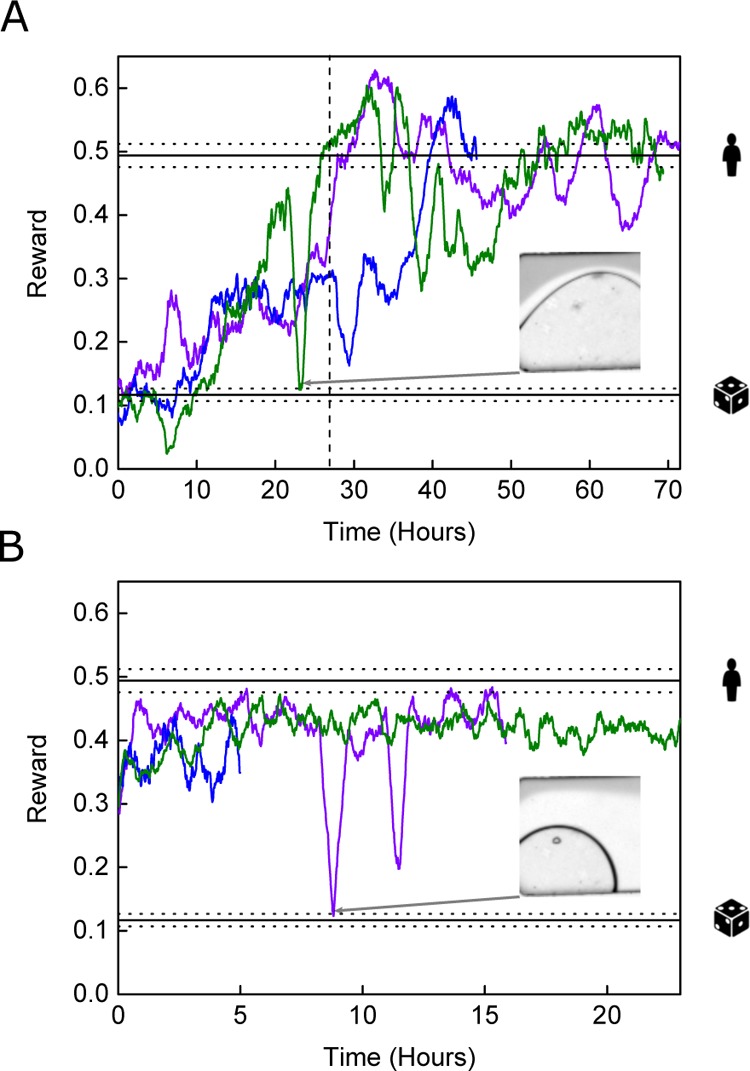
Figure 3.

Variation of the reward as a function of time for (A) DQN and (B) MFEC controllers within the laminar flow environment (N = 3). Inset widths are 150 μm. Benchmark performance ranges are displayed with dotted horizontal lines using mean performance and 95% confidence intervals. Human performance level is indicated with a human figure, and random performance level is indicated with a die. Data plotted with a 35 point moving average for clarity.
