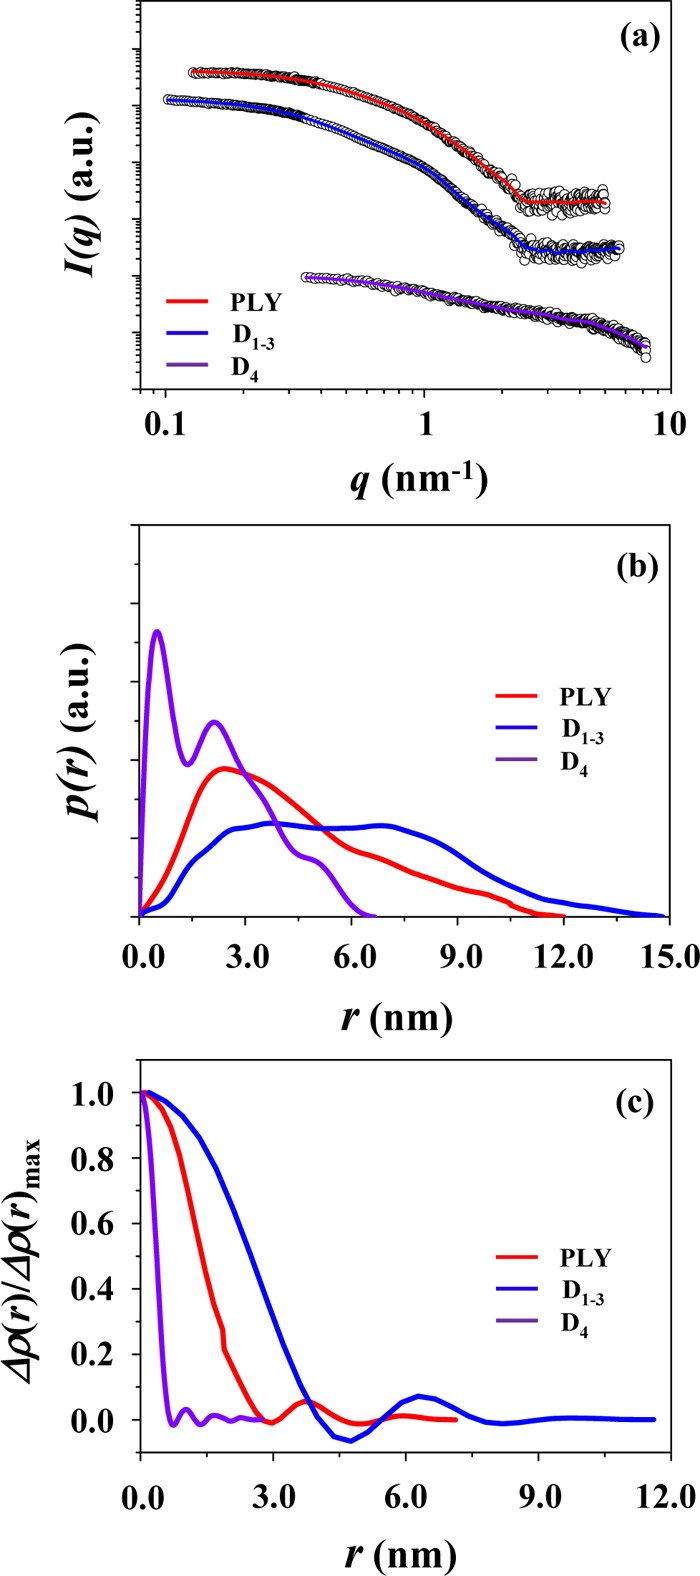
Figure 3.

IFT analyses of the X-ray scattering data in Figure 1: (a) the symbols are the experimental data, and the solid lines are the fits obtained from the data analysis; (b) pair distance distribution function p(r) profiles obtained by the data analysis; (c) electron density distribution function ρ(r) profiles obtained by the data analysis, which were normalized to the maximum density.
