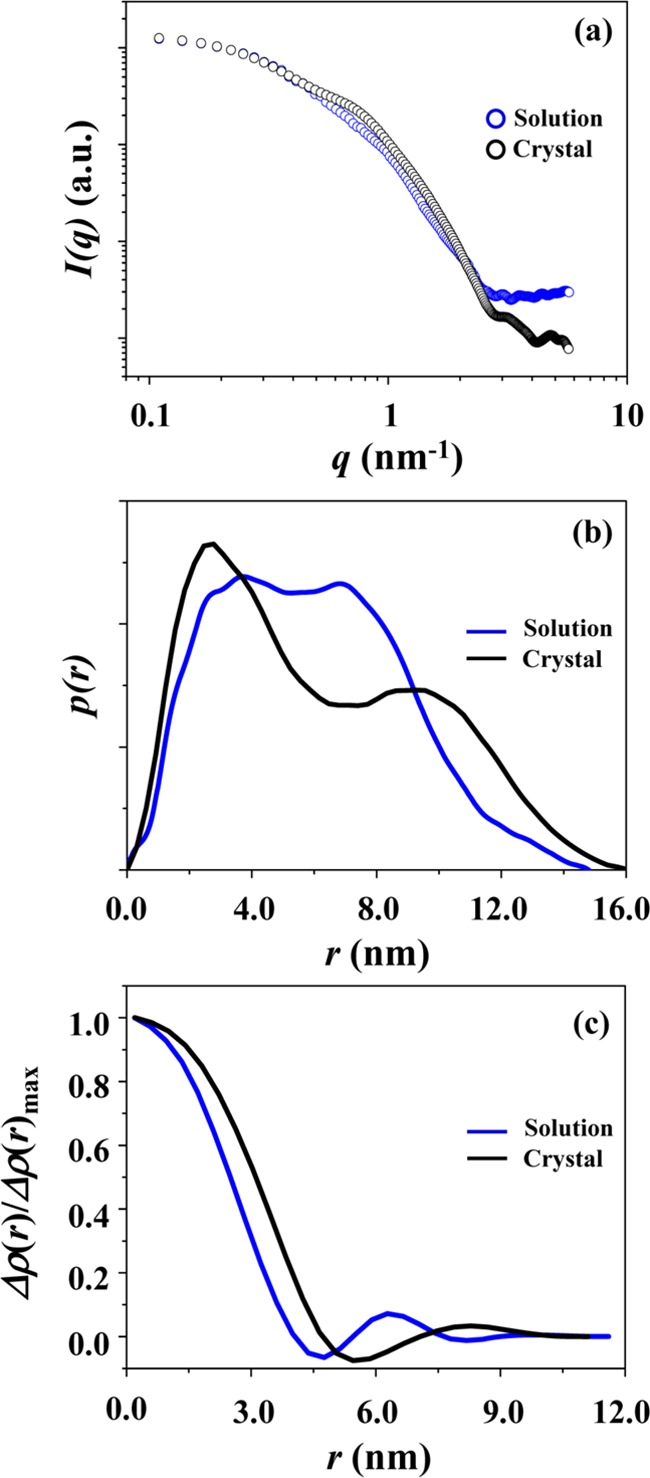
Figure 8.

D1–3: (a) the X-ray scattering profile (which was obtained by fitting the measured scattering data in Figure 1b using an IFT analysis program (GIFT or GNOM)) is compared with that calculated from the atomic coordinates for the most possible dimer (Figure 7) of the corresponding part in the crystallographic PLY structure using the program CRYSOL. (b) The comparison of the pair distance distribution function p(r) profiles obtained from the measured and calculated X-ray scattering data by the IFT analysis. (c) The comparison of the normalized electron density distribution function ρ(r) profiles obtained from the IFT analyses of the measured and calculated X-ray scattering data.
