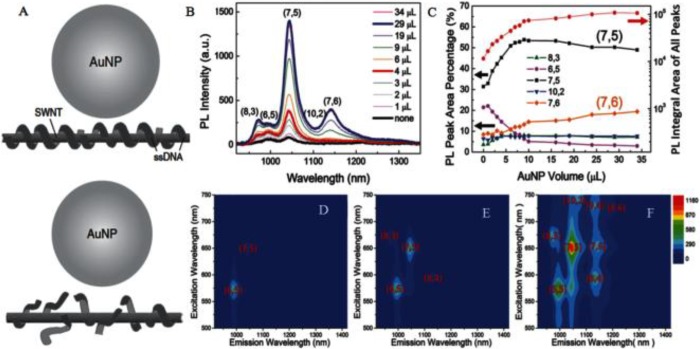
Figure 7.
(A) Schematic of PL enhancement of the recognition DNA-SWNT pair and the non-recognition DNA-SWNT pair. (B) PL emission spectra upon excitation at 650 nm of AuNP-(ATT)4AT-SWNTs with addition of concentrated AuNPs from 0 to 34 μL. (C) PL integral area of all peaks (red dots) and PL peak area percentage in (B). PLE maps of (D) the original (ATT)4AT-SWNTs solution, (E) solution with addition of 4 μL of AuNPs, and (F) solution with addition of 29 μL of AuNPs. PL intensities for (D)–(F) follow the same color scale. Reprinted with permission from ref (29). Copyright 2016 Wiley-VCH Verlag GmbH & Co. KGaA.

