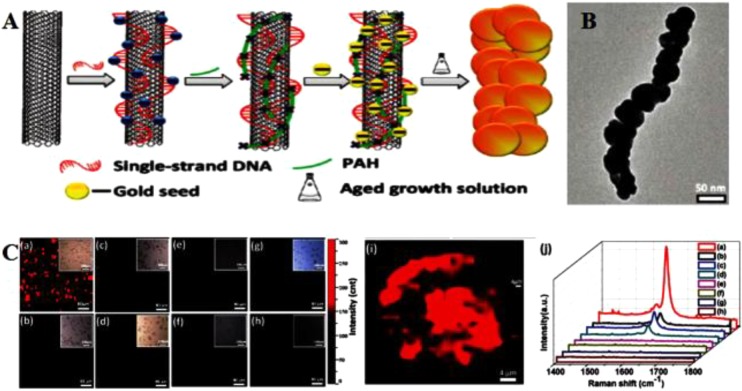
Figure 8.
(A) Schematic illustration of the synthesis of SWNT–metal nanocomposites. (B) Representative TEM images of the SWNT-Au-PEG nanocomposite. (C) Raman imaging and averaged Raman spectra of cells. (a–h) Raman images of SWNT-Au-PEG-FA (a,b), SWNT-Au-PEG (c,d), SWNT-PEG-FA (e,f), and SWNT-PEG (g,h) labeled KB (a,c,e,g) and HeLa (b,d,f,h) cells. Reprinted with permission from ref (188). Copyright 2012 American Chemical Society.

