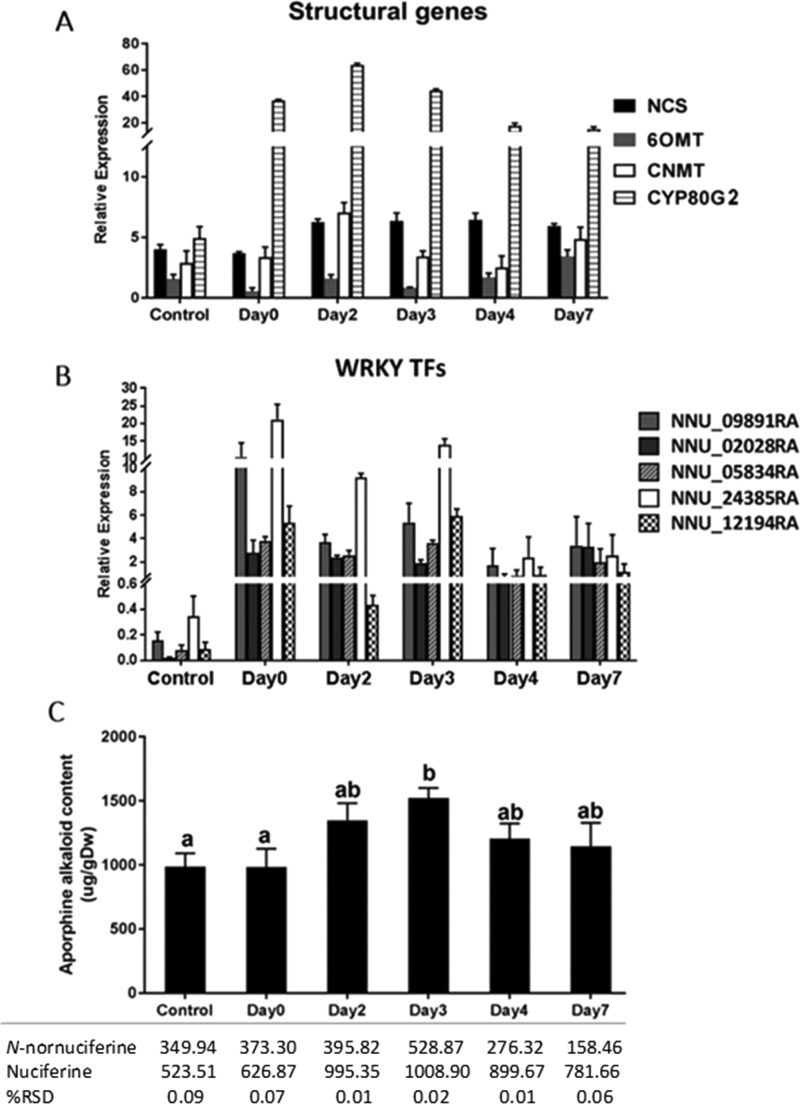
Figure 3.
Quantitative real-time polymerase chain reaction (qRT-PCR) and high-performance liquid chromatography (HPLC) analyses of wounded lotus leaves collected on various observation days. (A) Bar graph shows the relative expression of putative norcoclaurine synthase (NCS), norcoclaurine 6-O-methyltransferase (6OMT), coclaurine-N-methyltransferase (CNMT), and CYP80G2 in wounded lotus leaves. (B) Bar graph shows the relative expression of five putative WRKY TFs. (C) Sum of nuciferine and N-nornuciferine contents in the wounded lotus leaves. Error bars show the standard deviation (SD) of the mean. The different lowercase letters indicate significant differences at p < 0.05.

