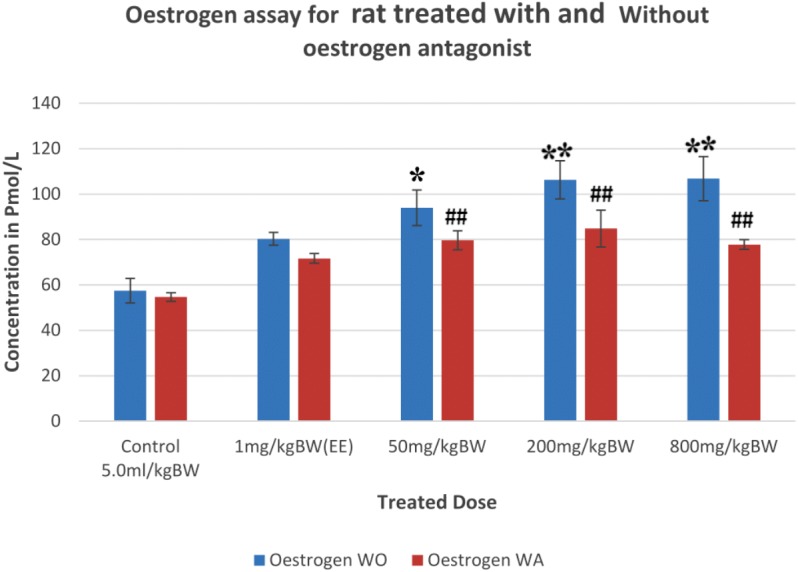
Figure 2. Oestrogen levels in rats treated with and without the administration of oestrogen receptor antagonist.

Values are expressed as mean ± SEM, n = 6, *P < 0.05, and **P < 0.005 vs. control without antagonist, ##P < 0.005 vs. control with antagonist. WO, without antagonist; WA, with antagonist; EE, ethinyl estradiol.
