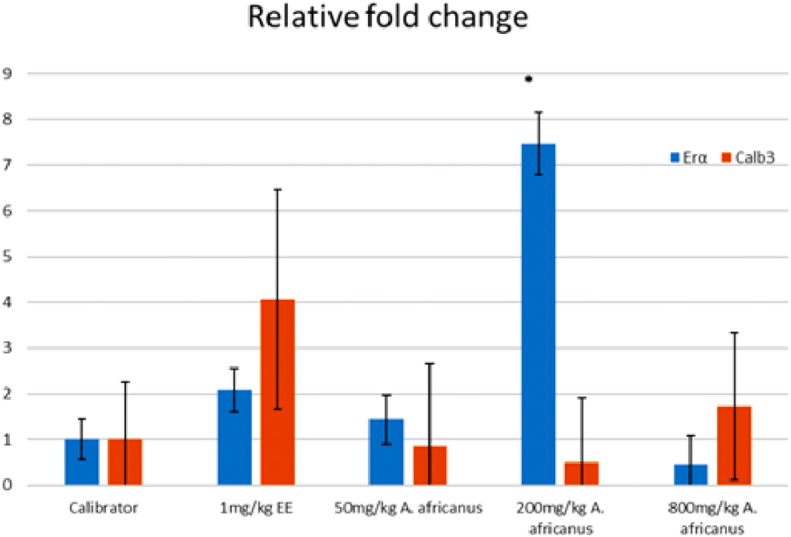
Figure 5. Graphical representation of gene expression of rats treated without oestrogen receptor antagonist.

Values were expressed and presented as mean ± SEM, (n = 4), *p < 0.005 vs. calibrator without oestrogen receptor antagonist. EE, ethynyl estradiol; Erα, oestrogen receptor alpha gene and Calb3, calbindin 3 gene.
