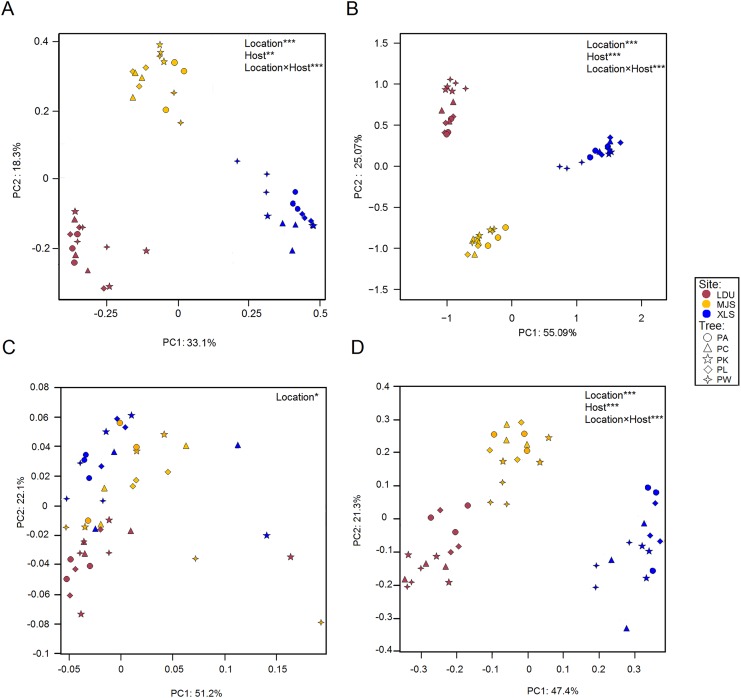
Figure 3. Principal Coordinate Analysis (PCoA) plot of OTUs of bacteria (A) and fungal (B) communities and KEGG orthologs (KOs) (C) and functional guilds (D) based on the Bray–Curtis distance matrix.
The symbols are as follows: circles = PA; triangles = PC; pentagram = PK; diamonds = PL; four-angle star = PW. Full name of each plant species is reported into the text. Symbol colors correspond to the different study sites as identified in Fig. 1 (wine red = LDU: Yuzhong campus of Lanzhou University in Lanzhou city; yellow = MJS: a site in the Xinglongshan forest in Majiasi; blue = XLS: Xiaolongshan forest farm in Tianshui City). The values are means of three replicate samples for each host type. Results of the PERMANOVA are given in the higher right of each panel: *p < 0.05; **p < 0.01; ***p < 0.001.

