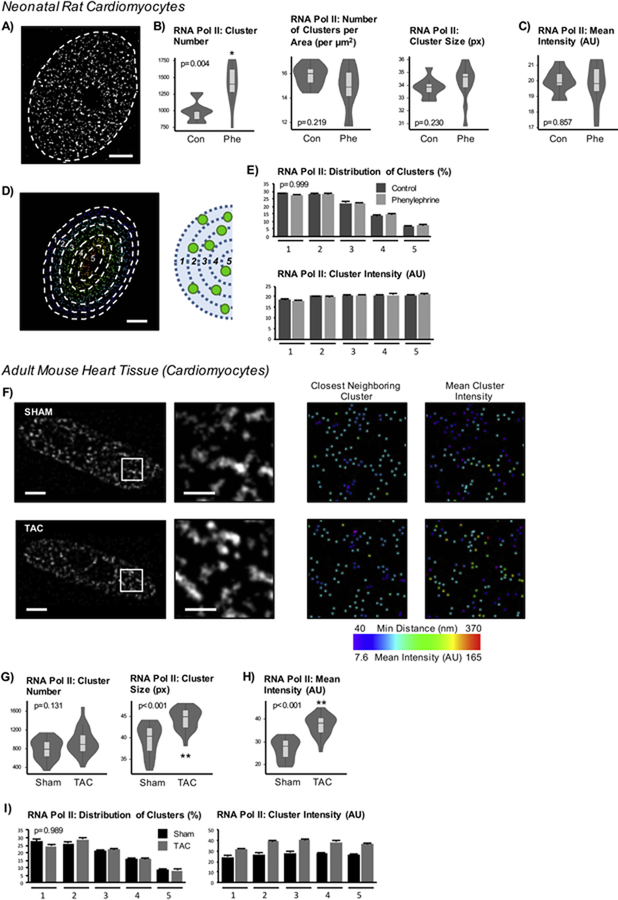
Figure 2. High transcriptional activity correlates with increases in cluster number in neonatal myocytes and increases in mean intensity and size in adult cardiomyocytes.
A) NRVMs were labeled with RNA polymerase II for STED imaging of cardiac transcription factories which were quantified using Imaris (non-nuclear signal was subtracted as background). Scale bar = 2µm. B) The number of clusters increases while the cluster density (spot number normalized to nuclear area) or size indicate no difference. C) Mean cluster intensity also does not differ. Together, these data suggest that increases in transcriptional activity are due to recruitment and activation of polymerases in the NRVM nucleus after agonist treatment. D) To examine the spatial distribution of puncta, the nucleus was divided into 5 bins based on the maximum and minimum distances to the periphery for each nucleus and then assessed cluster number and cluster intensity at each bin (1 is closest to and 5 is furthest from periphery). Scale bar = 2µm. E) The distribution of percent of total clusters per nucleus found within each bin is plotted (top) along with the mean intensities of the clusters (bottom). Treatment does not affect intensity distribution (p=0.861, two-way ANOVA). F) RNA polymerase II labeling was performed in adult mouse heart tissue sections in animals subjected to sham or TAC surgery, and cardiomyocyte nuclei from the fixed tissue sections were used for analyses (nuclei were selected based on co-labeling with desmin to ensure non-cardiomyocyte nuclei were not incorporated into analyses). Representative nuclei of RNA polymerase II-labeled nuclear are shown with respective magnifications and examples of subsequent cluster analyses. Scale bar = 3µm (1µm for magnification). G) RNA polymerase II total cluster number is not affected, but the mean cluster area does increase after pressure overload stress. H) Mean intensity of total active RNA polymerase II puncta is higher in nuclei from failing hearts. I) The distribution of spots across the nucleus does not differ between sham or TAC mice while the increase in intensity occurs uniformly across the nucleus as indicated by average of mean cluster intensity at each bin (p<0.001, two-way ANOVA). Control: n=10 nuclei; Phenylephrine: n=11 nuclei. Sham: n=21 nuclei; TAC: n=20 nuclei. (Imaging experiments, with different sets of control/phenylephrine -treated cells and sham/TAC hearts, were repeated >3 times. Representative dataset of analyses is presented here.) * p<0.05; ** p<0.001 [Mann-Whitney; for cluster distribution, Chi-squared]. Error bars represent SEM.

