
Figure 5. Localization of genes with respect to nuclear heterochromatin domains associate with patterns of differential expression.
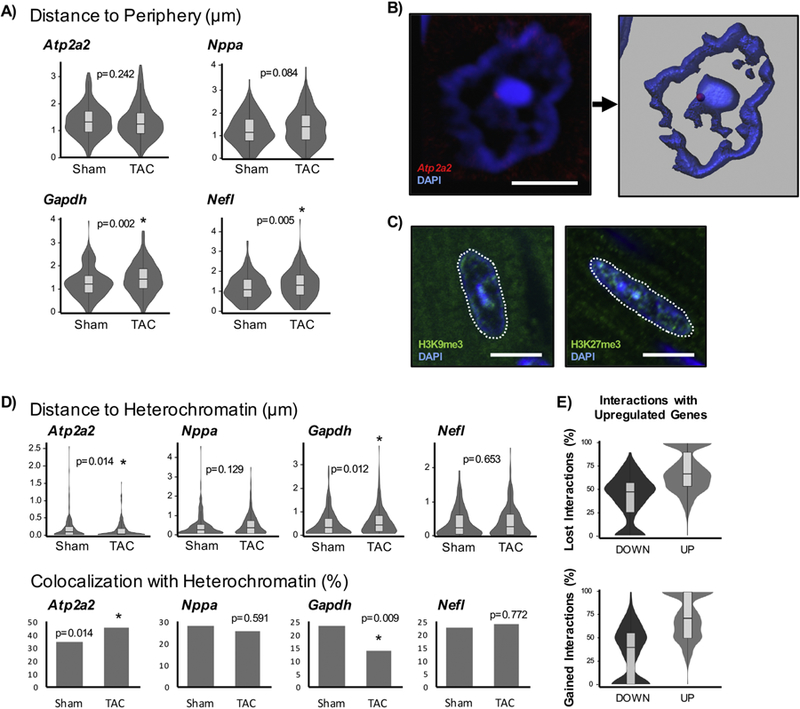
A) In addition to performing binned assessments of radial positioning of genes, the absolute distances to the nuclear periphery were examined (note that these are absolute distances and do not account for differences in nuclear shape or area). B) To measure the distance to constitutive heterochromatin, a DAPI intensity threshold was used in Imaris to create a surface. The closest distance of the FISH spot to DAPI surface was measured. If loci were found inside the surface (within the heterochromatin), they were assigned a distance of 0µm. Scale bar = 5µm. C) The intense DAPI signal corresponds to constitutive heterochromatin, marked by H3K9me3, and is separate from facultative heterochromatin, indicated by H3K27me3. H3K9me3 colocalizes well with DAPI while H3K27me3 is found throughout the nucleus. Scale bar = 10µm. D) The distribution of absolute distances to heterochromatin are shown on top. The fractions of loci that colocalize (have distances of 0µm and associate directly with heterochromatin), are shown on bottom. Atp2a2: Sham n=205 loci, TAC n=298; Nppa: Sham n=216, TAC n=190; Gapdh: Sham n=226, TAC n=212; Nefl: Sham n=192, TAC n=227. E) HiC data was used to examine gene-gene interactions from isolated sham and TAC cardiomyocytes [23]. The lost and gained interactions for significant differentially expressed genes (DOWN or UP) with other differentially expressed genes are described. Genes that are upregulated associate with other upregulated genes while those that are downregulated show the inverse relationship, providing support for genes with similar expression behavior tend to congregate together. * p<0.05 [Mann-Whitney; for co-localization, Chi-squared].