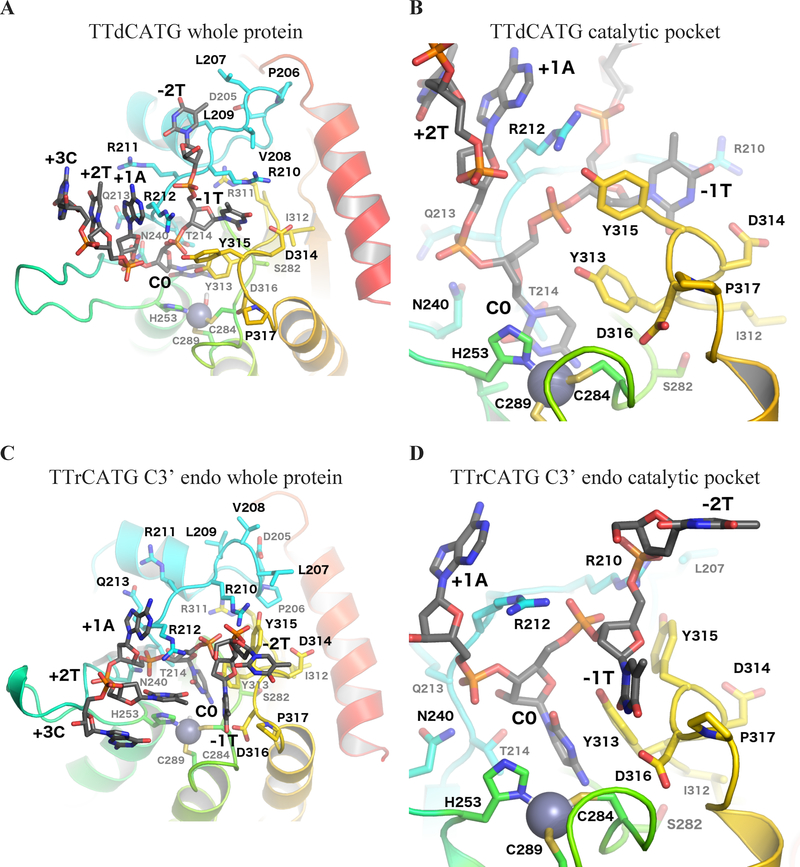
Figure 2:
Binding site-adjacent residues. (A) Whole protein view and (B) catalytic pocket focused view of the simulation with target dC, showing the starting (crystal structure-based) conformation of the substrate oligonucleotide after minimization. (C) Whole protein view and (D) catalytic pocket focused view of the average structure of the C3’ endo portion of the rC simulation, as determined by POVMEpocket shape analysis. Loop 1 is shown in light blue, loop 3 in dark green, loop 5 in light green, and loop 7 in yellow.

