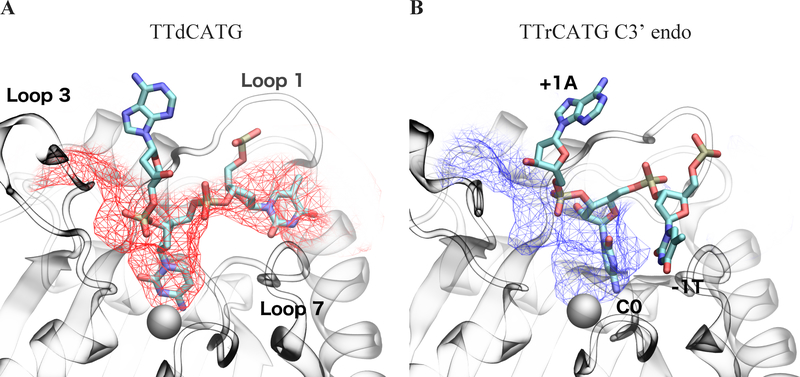
Figure 3:
Average binding cleft shapes differ between (A) dC simulations (C2’ endo/deoxyribose, red) and (B) the portion of the rC simulation after the sugar pucker change (C3’ endo/ribose, blue). Mesh shows average pocket shape along the DNA binding cleft observed in crystal structures. The atoms in the dC figure structure are the initial coordinates of the simulation, while C3’ endo atomic coordinates are taken from the POVME cluster centroid snapshot. The −1 T in the TTrCATG C3’ endo snapshots leaves the original substrate binding cleft and is no longer in the pocket defined in the 5TD5 crystal. Images are taken from the same angle and structures are RMSD-aligned. Catalytic zinc is shown as a gray sphere.

