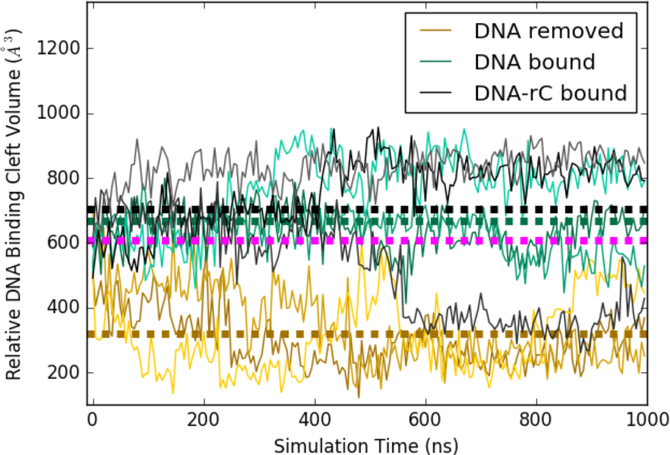
Figure 6:
Relative pocket volumes of A3Bctd substrate binding cleft duringMD simulations. Each simulation was run in triplicate, with replicates shown as lighter and darker shades of the same color. Average pocket volumes are shown as thick dotted lines. Average volume from the same analysis performed on A3A apo simulations used in prior work shown in magenta.32

