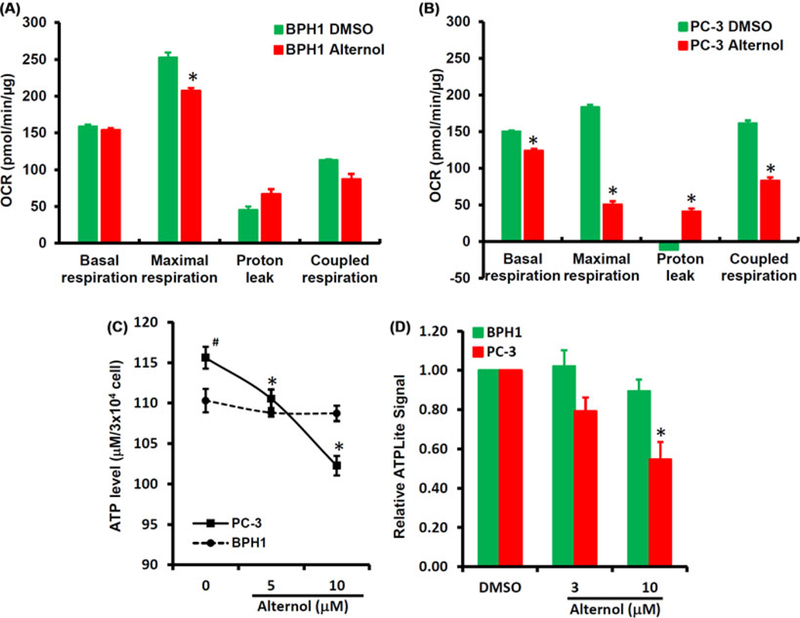
FIGURE 4.

Alternol reduces mitochondrial respiration and ATP production. A-B, BPH1 or PC-3 cells were seeded in XF24-well plates and the OCR was determined with XF24 × 3 Extracellular Flux Analyzer as described in the text.28 The asterisk indicates a significant difference compared to DMSO control (Student’s t-test, P < 0.05). C, PC-3 and BPH1 cells were left untretaed or treated with Alternol (5–10 μM) for 4 h. ATP contents were analyzed using a HPLC-based approach as described.29 The asterisk indicates a significant difference compared to the untreated cells (Student’s t-test, P < 0.05) and the # sign indicates a significant difference compared to BPH1 cells (Student’s t-test, P < 0.05). D, PC-3 and BPH1 cells were treated with DMSO, Alternol (3–10 μM) for 4 h and cellular ATP contents were determined using ATPLite™ assay kit. The relative ATP levels were calculated when the reading for DMSO-treated cells was set at 1 after normalized with total protein levels in each samples. The asterisk indicates a significant difference compared to DMSO control (Student’s t-test, P < 0.05).
