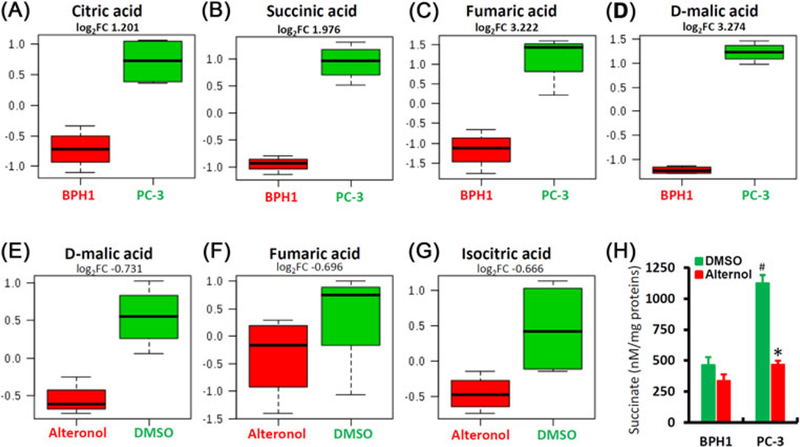
FIGURE 7.

Alternol attenuates mitochondrial metabolism. A-D, Comparison of four major Krebs cycle intermediates between PC-3 and BPH1 cells. PC-3 and BPH1 cells were harvested for metabolomic analysis using the gas chromatography-mass spectrometry (GC-MS) as described in the text. Individual comparison for each mitabolites was shown with fold change values (log2FC). E-G, PC-3 cells treated with DMSO or Alternol (10 μM) for 4 h were harvested for metabolomic analysis as described above and the The individual comparison was shown with fold change values (log2FC). H, PC-3 and BPH1 cells were treated with DMSO or Alternol (10 μM) for 4 h. Whole cell lysates were used for the measurement of succinate levels using an assay kit from BioVision. Succinate levels were normalized with protein concentrations. The asterisk indicates a significant difference compared to DMSO control (Student’s t-test, P < 0.05) and the # sign indicates a significant difference compared to BPH1 cells (Student’s t-test, P < 0.05)
