Figure 6.

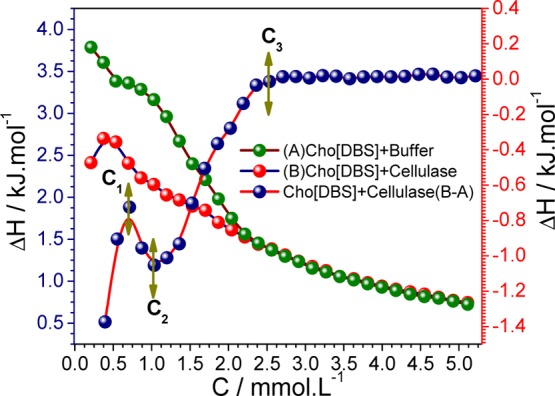
ITC enthalpogram of Cho[DBS] aggregation in the buffer (A) and cellulase solution (B) and subtracted binding isotherm (B – A) with the cellulase enzyme [right “Y axis” represents the enthalpy of the actual binding isotherm (B – A)].

ITC enthalpogram of Cho[DBS] aggregation in the buffer (A) and cellulase solution (B) and subtracted binding isotherm (B – A) with the cellulase enzyme [right “Y axis” represents the enthalpy of the actual binding isotherm (B – A)].