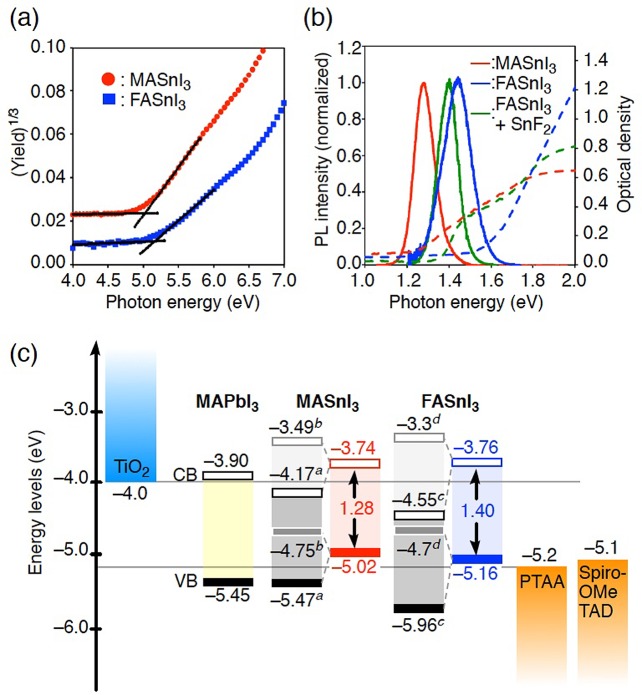
Figure 5.
(a) PYS spectra of MASnI3 (red) and FASnI3 (blue) measured under vacuum (<10–2 Pa).30 (b) Photoluminescence (PL) (solid line) and absorption spectra (dashed line) of MASnI3 (red), FASnI3 (blue), and FASnI3 with 10% SnF2 (green), measured under Ar (O2, H2O < 10 ppm). (c) Energy level diagram of TiO2, MAPbI3, MASnI3, FASnI3, PTAA, and Spiro-OMeTAD. aRef (26); bref (25); cref (28); dref (27).

