Figure 7.

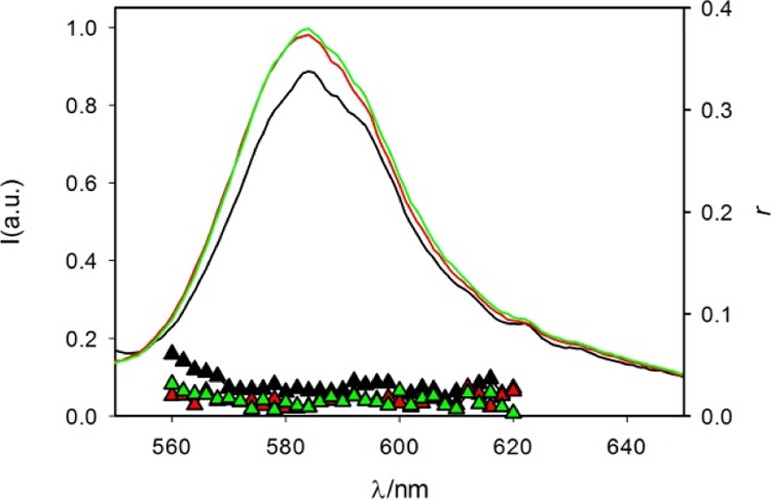
Fluorescence spectra (λexc = 530 nm) of RhB in sample 4 (HR) (black line), 5 (HR-T) (red line), and 6 (HR-TG) (green line) and fluorescence anisotropy of the same samples: black, red, and green triangles, respectively.

Fluorescence spectra (λexc = 530 nm) of RhB in sample 4 (HR) (black line), 5 (HR-T) (red line), and 6 (HR-TG) (green line) and fluorescence anisotropy of the same samples: black, red, and green triangles, respectively.