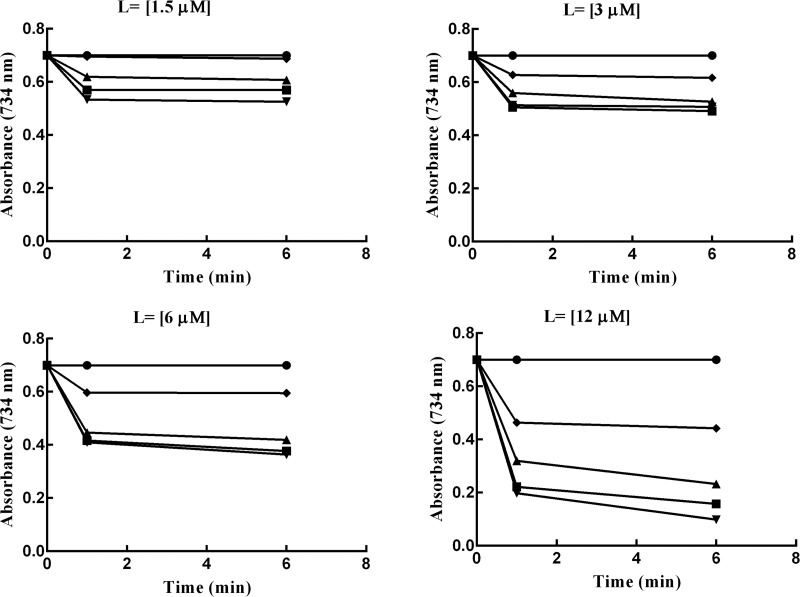
Figure 2.
Effects of time on suppression of the absorbance of the ABTS•+. The experiments were performed in different concentrations of each ligand (1.5–12 μM). The curves represent the effects of the specific antioxidant on the suppression of the absorbance of the ABTS•+ at 734 nm. The symbols used are as follows: control ABTS•+ radical cation (solid circles), 4f (squares), 4g (upward triangles), 4h (downward triangles), and 4i (diamonds).

