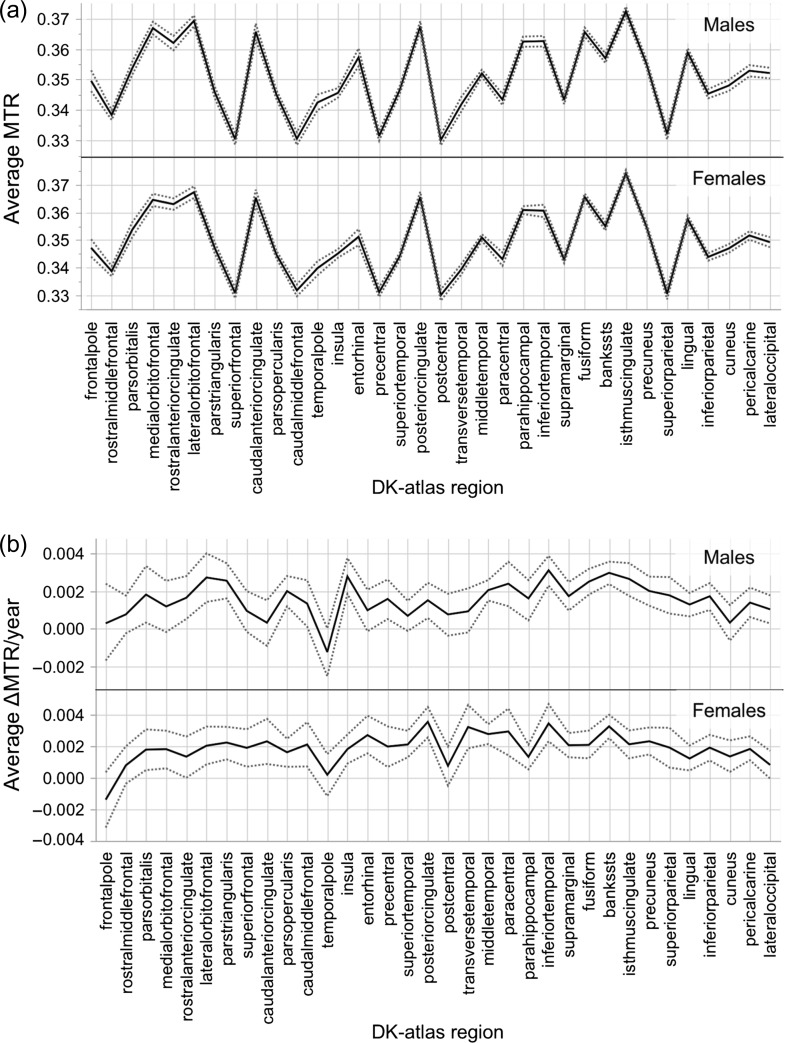
Figure 2.
(a) Inter-regional variation in average magnetization transfer ratio (MTR) for males (top) and females (bottom) at Visit 1, across the 34 regions of the Desikan-Killiany atlas. (b) Inter-regional variation in average ΔMTR/year profiles for males (top) and females (bottom), across the 34 regions of the Desikan-Killiany atlas. Regions are arranged from anterior to posterior location (based on the center-of-gravity of each parcel). Dashed gray lines represent 95% bootstrapped confidence intervals.

