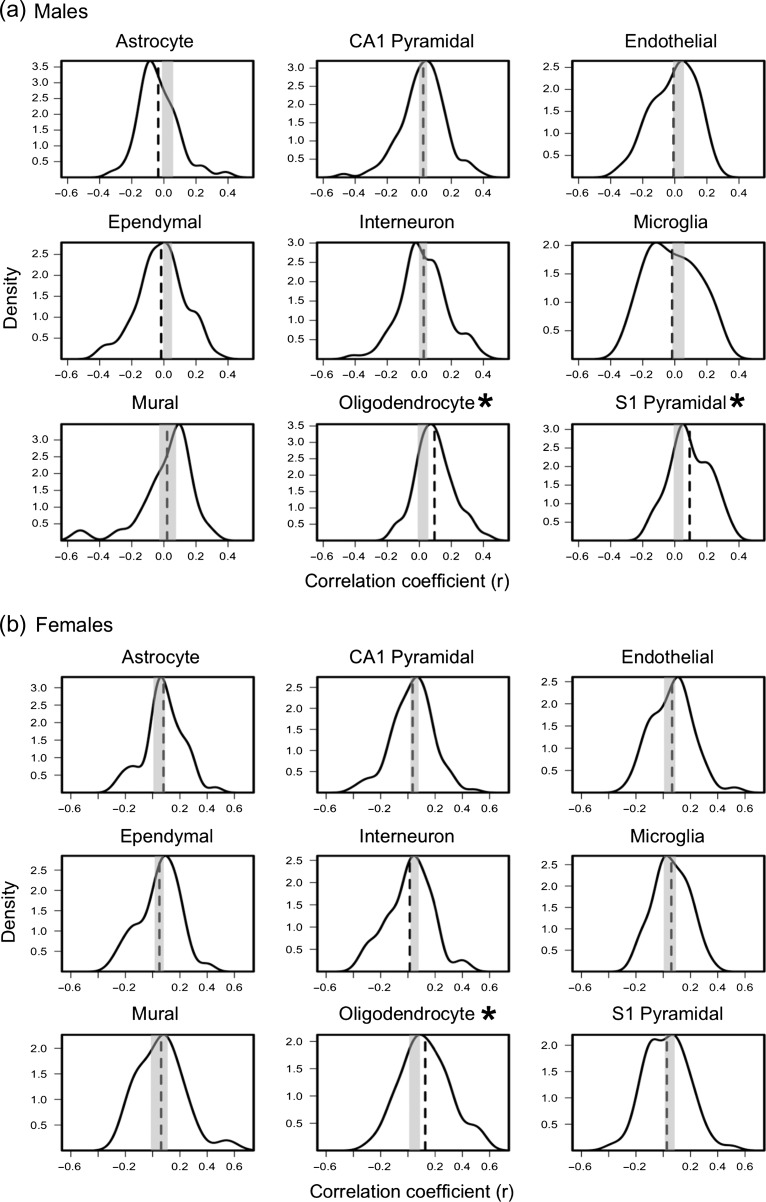
Figure 4.
Distribution of correlation coefficients obtained by correlating (across the 34 regions) inter-regional profiles of expression of genes specific to 9 cell-types with inter-regional profiles of ΔMTR/year profile in males (a) and females (b). Vertical dashed-lines represents average expression-ΔMTR/year correlation coefficient (quantified in Table 1). Gray box represents 0.5% and 97.5% of critical values obtained from the empirical null distribution of the average expression-ΔMTR/year correlation coefficients. Red * indicates FDR-corrected P-value < 0.05.

